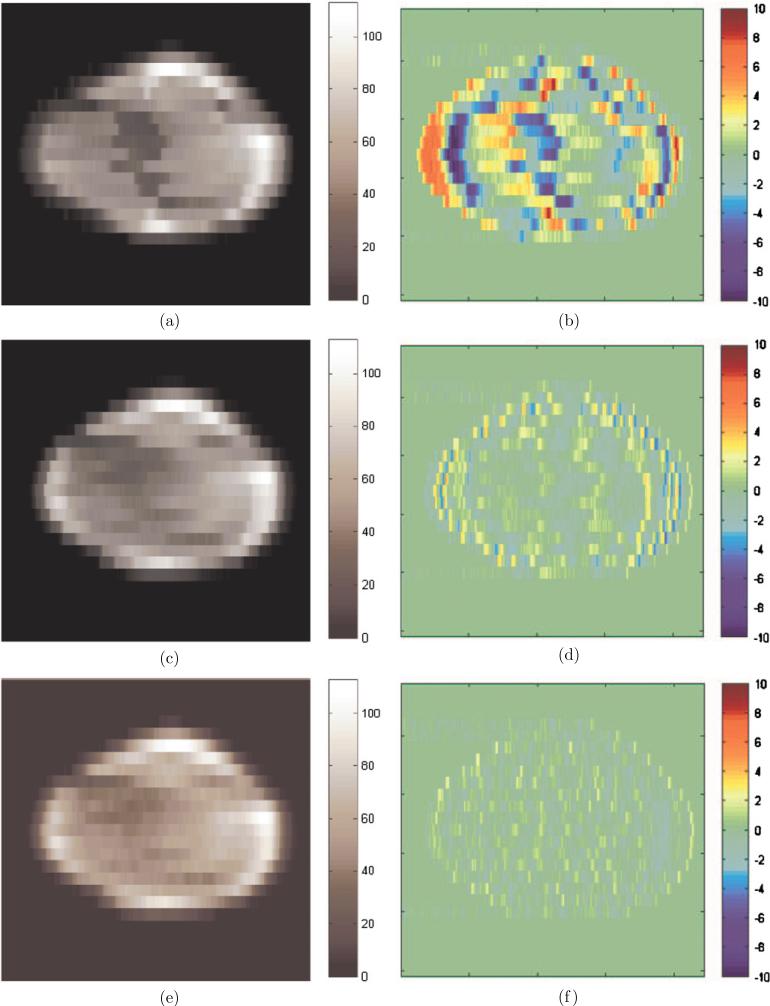
Figure 8.
Delivered fluence maps (a), (c), (e) and fluence differences (b), (d), (f) with motion-corrected leaf sequences under different settings of clinical parameters: (a), (b) collimator angle 180°, initial phase 0°, dose rate 600MU min−1 and machine tolerance 2 mm; (c), (d) collimator angle 90°, initial phase 320°, dose rate 400MU min−1 and machine tolerance 5 mm; (e), (f) collimator angle 90°, initial phase 320°, dose rate 100MU min−1 and machine tolerance 3 mm.

