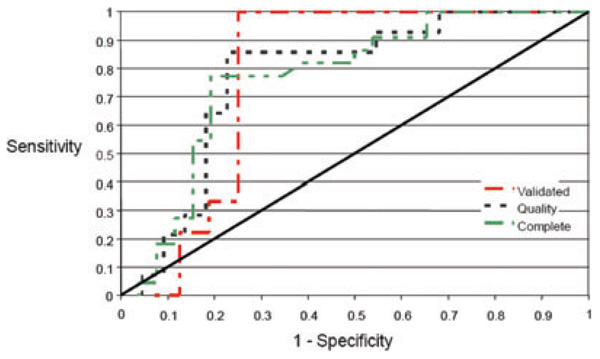
FIG. 3.
ROC curves for fMRI detection of deception. Plots of sensitivity and specificity were used to generate curves representing the number of significantly activated voxels at a t-value greater than or equal to 1.645 in clusters 1, 2 and 4 (Kozel et al. 2005) on the task [(disk – neutral) – (envelope – neutral)] for the Complete, Quality and Validated groups. The straight line represents a diagnostic test that is no better than chance and the jagged line represents the trade-off between sensitivity and specificity amongst each group.

