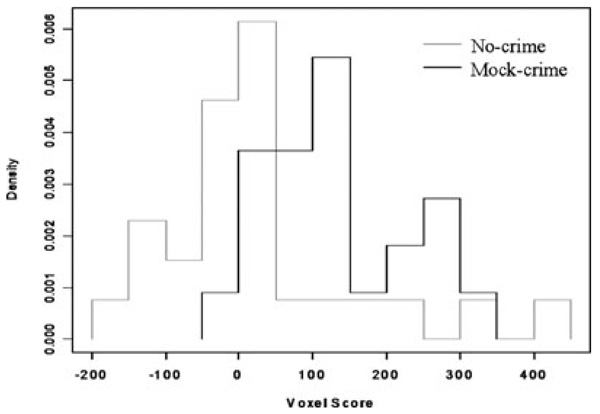
FIG. 4.
Distribution of voxel number difference values for the Mock-crime and No-crime participants. The individual participant’s voxel difference score for the Complete Group was plotted to assess differences in distribution of values for the Mock-crime and No-crime participants. The x-axis is the voxel difference score and the y-axis is the normalized frequency. This is indicated as “Density” such that the area under the curve for each group is 1. This enables the two groups to be more equitably compared. The Mock-crime (in red) has a distribution clearly to the right of zero (i.e., a correct call would be greater than zero), where as the No-crime (in green) group (i.e., a correct call would be less than zero) has a much more dispersed distribution as would be expected from the sensitivity results and ROC curves.

