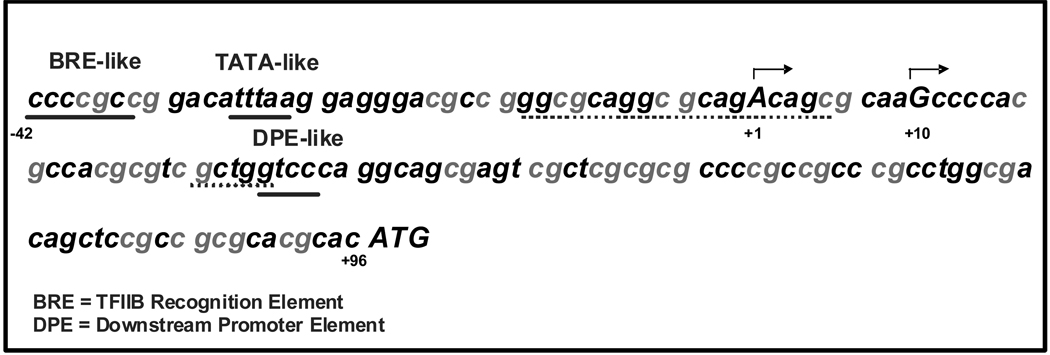
Figure 2.
Schematic representation of the upstream structure of the PCFT gene. The sequence [−42/+96] is shown including a predicted promoter sequence (www.fruitfly.org/seq_tools/promoter.html), BRE and TATA-like sequences (underlined), reported initiation sites (capitalized base pairs with arrows) (NM_080669, BC010691) arbitrarily positioned at +1 and +10. Conserved human and mouse nucleotides are indicated by dots; a DPE-like sequence is underlined. The GC rich nature of the human PCFT minimal transcriptional regulatory region is shown by a high G+C content (77%) and the presence of 24 CpG dinucleotides indicated in grey.

