Figure 4.
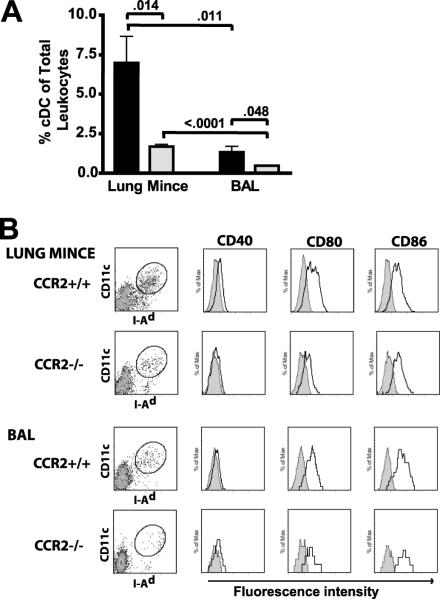
Comparison of cDC percentage and phenotype amongst cells isolated from the lung interstitial and alveolar compartments. CCR2+/+ and CCR2−/− mice were infected with C. neoformans. At day 14 post-infection single cell populations were obtained from two sources: lung mince (enzyme digested lung post-lavage) or bronchoalveolar lavage (BAL). cDC were identified as MHC Class II (I-Ad)+/CD11c+ cells using the gating strategy outlined in Methods (and per Figure 2). (A) Frequency of lung cDC (% of CD45+ cells) in lung mince and BAL (CCR2+/+, black bar; CCR2−/− mice, gray bar). Data represents a mean ± SEM of 5 mice assayed individually per time-point; p values indicate unpaired student t-test between comparative groups. (B) Representative scatter plots (I-Ad vs CD11c) and histograms (cDC, circular gates) depict staining for the indicated receptors within representative cDC populations identified from lung mince (top panels) and BAL (bottom panels). Open histograms represent specific staining; solid shading show isotype-control staining. Note that the paucity of cDC recovered from the BAL of CCR2−/− mice (bottom-most panels) made analysis of co-stimulatory molecule expression difficult.

