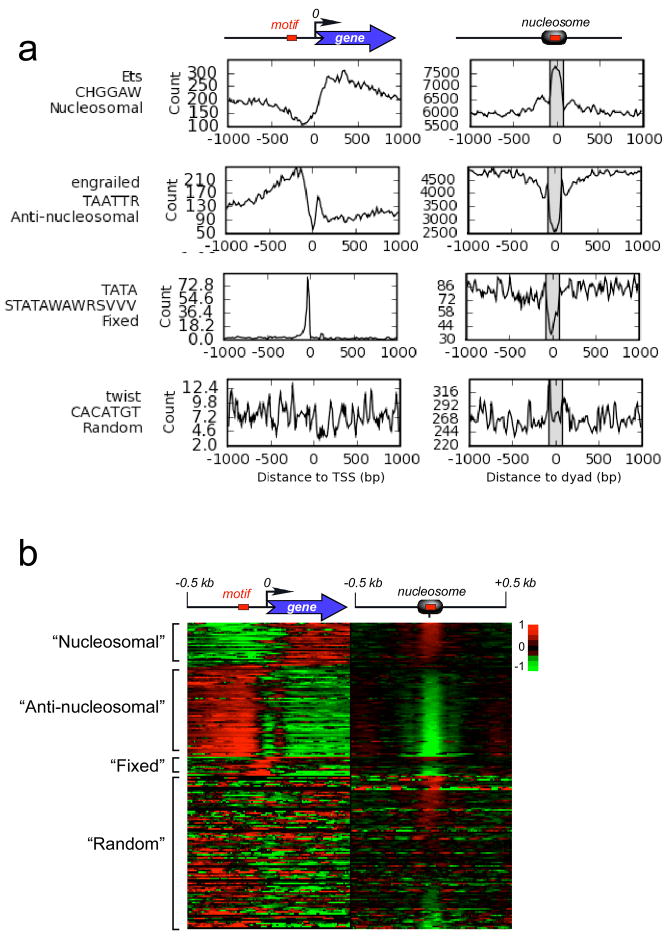
Figure 2. Organization of conserved DNA motifs around TSSs (left) and nucleosomes (right).
a, Distribution of representative conserved DNA motifs from four distribution classes. b, Distribution of all motifs plotted with Treeview46. Bin counts from all motifs in Fig. S12 were converted to fold deviations from the regional average (−/+ 1 kb), converted to a log2 scale, and plotted. Red/black/green denotes above, near, or below average deviations, respectively.

