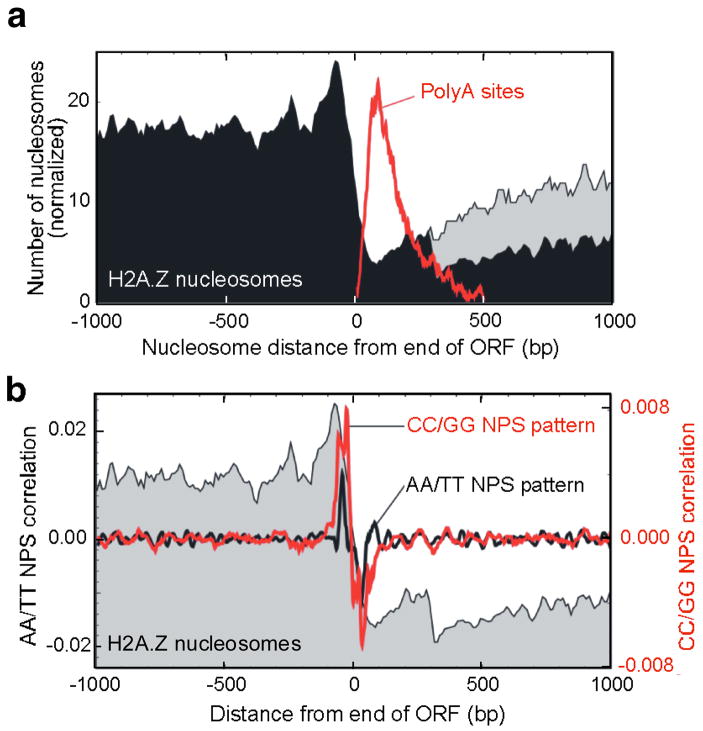
Figure 4. H2A.Z nucleosomal organization around the 3′ end of Drosophila genes.
a, Composite distribution of nucleosomes relative to ORF end points. Also shown is the distribution of transcript termination sites (polyA sites) in red. Nearby genes were either included (gray) or eliminated (black) from the analysis. b, Average correlation of all Drosophila gene terminal regions to AA/TT or CC/GG NPS patterns. The nucleosome profile from panel a is shown as a gray backdrop.

