
Figure 5. Distribution of Pol II and Pol II-engaged nucleosomes around the 5′ end of genes.
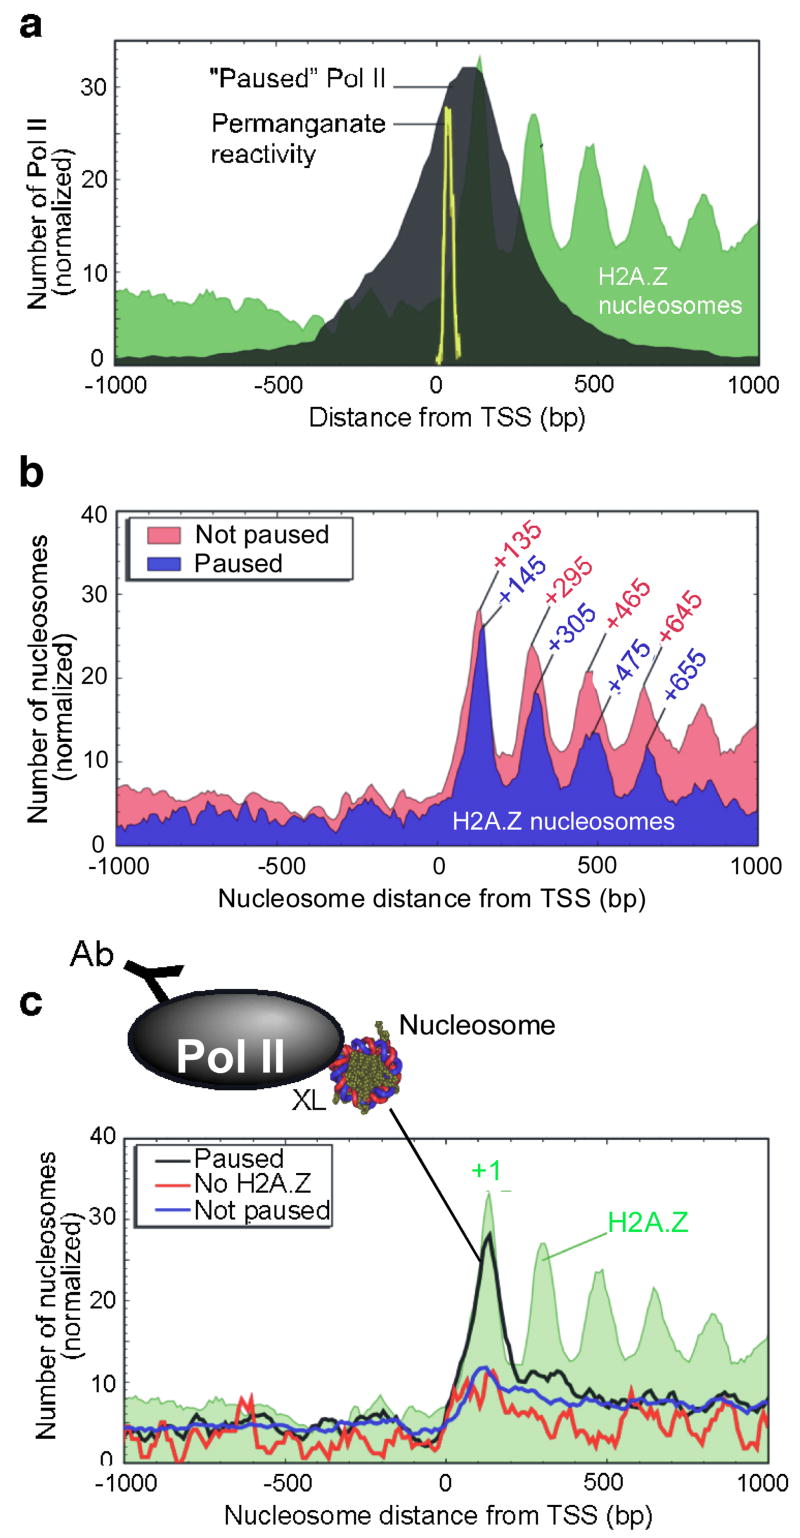
a, Genome-wide location of “Paused” Pol II relative to the TSS. ChIP-chip genomic profiling of Pol II was conducted on Drosophila embryos. The black filled plot shows the distribution of Pol II at 1,956 “Paused” Pol II genes (see Methods). The yellow trace shows the distribution of permanganate-reactive thymines (an indicator of pausing) in 50 genes that undergo pausing30. The distribution of Pol II at these 50 genes is similar to the bulk profile (Fig. S18a). b, H2A.Z nucleosomal distribution at 1,956 genes that contained “Paused” Pol II. The “Not paused” class represents those where Pol II is either absent or not paused. c, Distribution of Pol II-bound nucleosomes. Pol II ChIP was performed on bulk MNase-digested mono-nucleosomal DNA and hybridized to genome-wide tiling arrays. The three traces include distributions at 1,956 Pol II “Paused” genes, and control distributions either at 788 genes that have “No H2A.Z” within 1 kb of the TSS, or at 8,736 genes of the “Not paused” class.