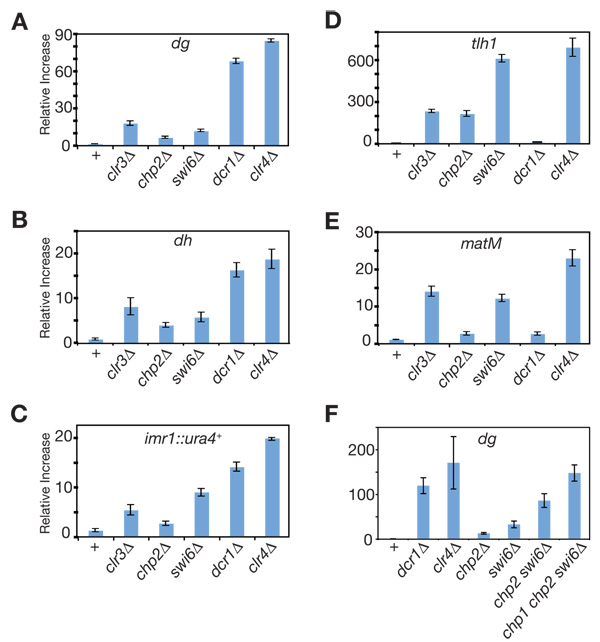
Figure 5. Swi6 and SHREC2 components make non-redundant contributions to heterochromatic gene silencing.
Quantitative real-time RT-PCR showing the steady-state levels of (A) dg, (B) dh, (C) imr1::ura4+ (D) tlh1+, and (E) matM transcripts in swi6Δ cells compared to wild-type, clr3Δ, chp2Δ, dcr1Δ and clr4Δ cells. (F) The steady-state levels of the dg transcript in chp2Δ swi6Δ double, and chp1Δ chp2Δ swi6Δ triple mutant cells were compared to single mutants. See Figure 4SA for additional data, including chp1Δ, chp1Δ chp2Δ, and chp1Δ swi6Δ cells at dg dh, imr1::ura4+, and tlh1+. Error bars represent standard deviations for three independent biological experiments. All values were normalized to act1+ transcript levels.

