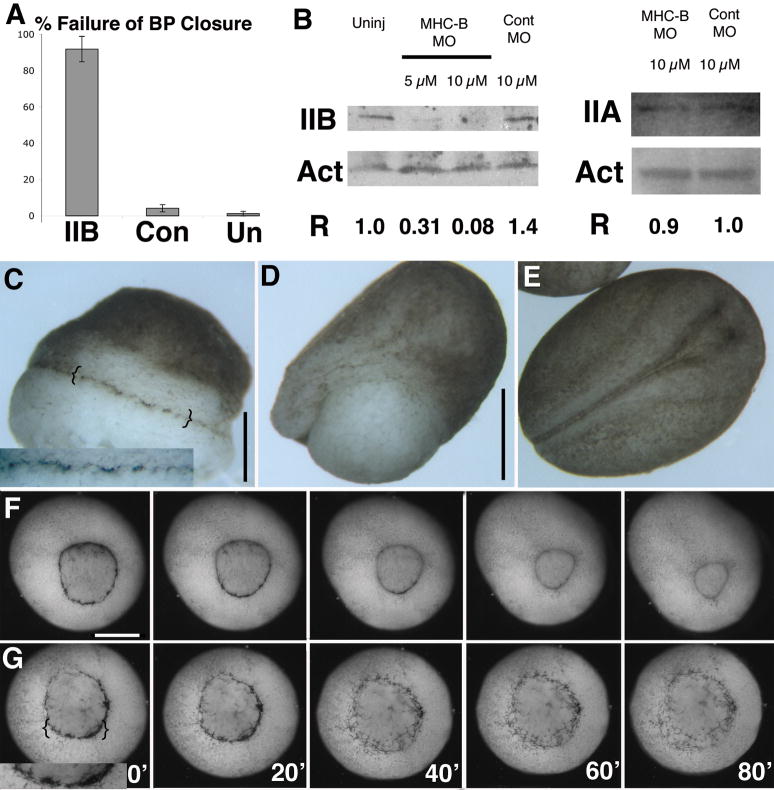
Figure 2.
Percent of embryos failing to close the blastopore is plotted for 10 μM IIBMO (n = 74), 10 μM control (n = 72) and uninjected (n = 84) embryos, with SEM (standard error of the mean)(A). Western blots showing MHC-B (IIB), MHC-A (IIA) and actin (Act) levels in uninjected, 5 μM and10 μM morpholino, and 10 μM control morpholino embryos. The normalized ratio of MHC-B or MHC-A to Actin (R) is also shown (B). A representative morphant embryo (C), a unilaterally (right-side)-morphant embryo (D), and a control embryo (E) at stage 19 are shown. Time-lapse movie frames show the vegetal (blastopore) view of development of a 10 μM morphant (F) and a 10 μM control embryo (G) with time in minutes shown. Insets show bottle cells. Scale bars are 500 μm, except in D at 1 mm.

