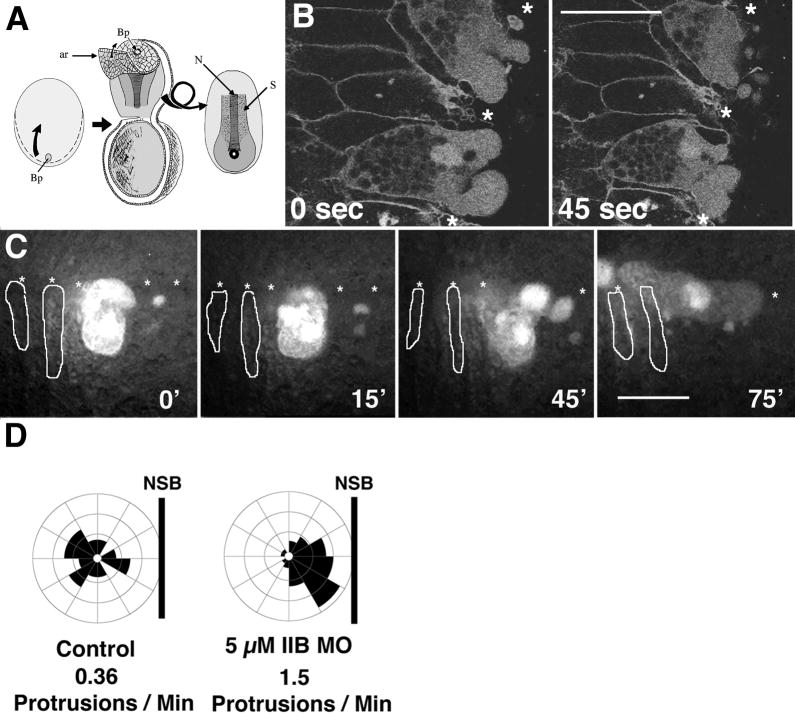
Figure 4.
Explanting the dorsal tissues of a neurula above the blastopore (Bp) and removing the endodermal archenteron roof (ar) exposes the notochord (N) and somitic mesoderm (S) for imaging during CE (A). In such explants confocal time-lapse imaging of a notochord mosaic for cells injected with 5μM MHC-B morpholino reveals that morphant cells (labelled) in the background of a notochord expressing a membrane bound GFP (revealing cell outlines) shows the loss of regulation of polarized cell motility (B). An epi-fluorescent time-lapse sequence of these cells exhibit aberrant cell motile behaviors and eventually are excluded from the notochord (C). Control notochordal cells at or near the notochord-somite boundary (NSB) exhibit monopolar motile behaviors, with few protrusions toward the notochord-somite boundary, while 5 μM morphant cells both express increased motility, and improperly direct this motility towards the boundary (D). One unit represents six percent of the total protrusive activity directed towards that sector, and is each sector is oriented relative to the notochord-somite boundary. Asterisks represent the notochord-somite boundary, and scale bars are 50 microns.

