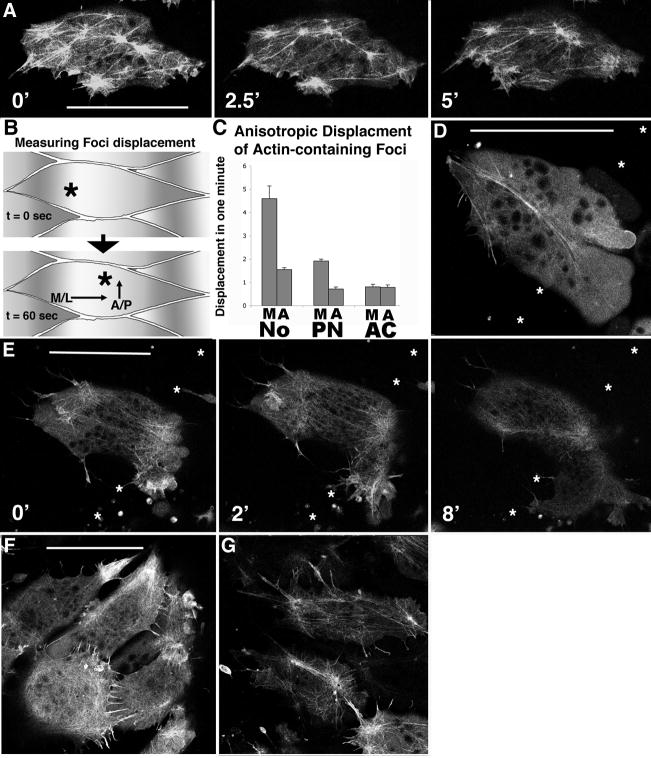
Figure 5.
Confocal microscopy of control cells injected with moesin-GFP reveals a dynamic cortical actin network in a basket-like distribution, with 3–5 foci of actin visible per cell (A). These actin-rich foci visibly move within the cell on a sub- minute timescale (astericks in A). Plotting the relative displacement of foci along the embryonic axis, both the medial-lateral direction and the anterior-posterior direction (B), reveals that the rate of displacement of these foci is greater in the medial-lateral (M) dimension that in the anterior-posterior dimension (A) for notochordal cells (No) (p<0.02 by students t-test), and this polarity is detectable in pre-notochordal cells (PN) but not in animal cap cells (AC) (C). In contrast to control cells, MHC-B injected cells reveal dramatic disruption of the cortical actin network (D). Confocal time-lapse sequence of a morphant cell exhibiting aberrant motility concomitant with cortical actin breakdown (E). Asterisks indicate notochord-somite boundary, and elapsed time is shown in minutes. Mildly morphant notochordal cells (1 μM MO) remain in notochord with intact cortical actin networks, but exhibit profuse filopodia (E) relative to control notochordal cells (F), revealing a threshold cell polarity phenotype in response to MHC-B depletion. Asterisks represent the notochord-somite boundary, and scale bars are 50 microns.

