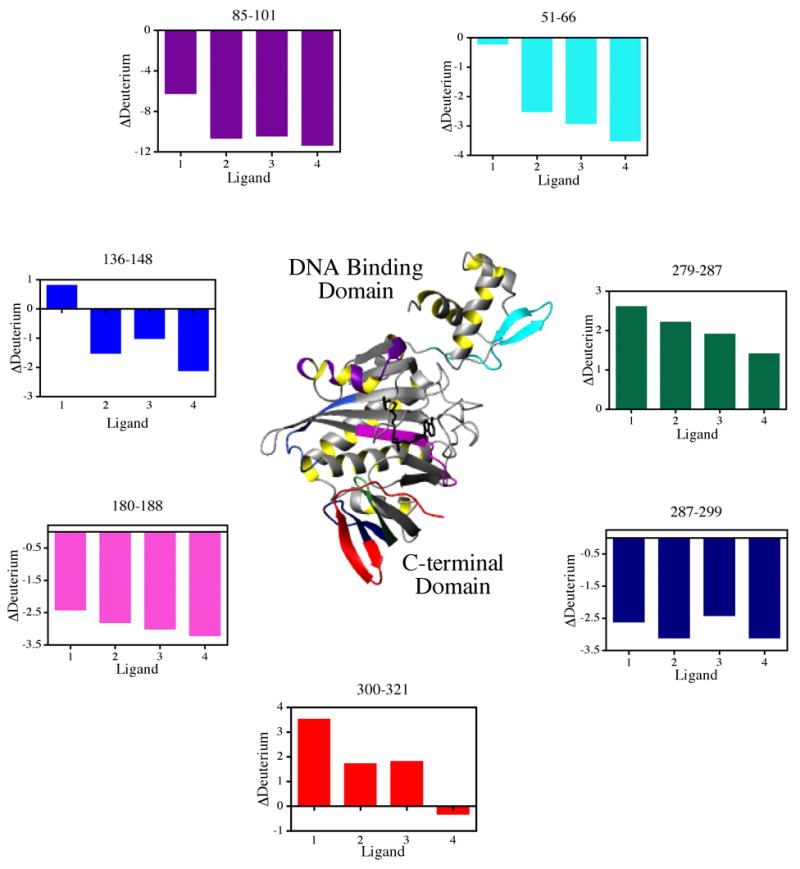
Figure 6.

Summary of results of hydrogen-deuterium exchange mapped on the 3-dimensional structure of BirA. The color-coded bar graphs show the difference in deuterium content relative to that measured for the unliganded repressor for each of the relevant peptides. The model was created in MolMol (35) using the input PDB file 2ewn.
