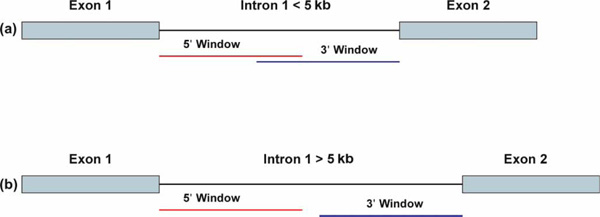
Figure 1.

Schematic of the intron 1 regions covered in the analysis. The 5' windows (2.5 kb) and 3' windows (2.5 kb) of the intron 1 regions were included in the analysis. (a) The intron 1 region is smaller than 5 kb. (b) The intron 1 region is larger than 5 kb.
