
Figure 4.
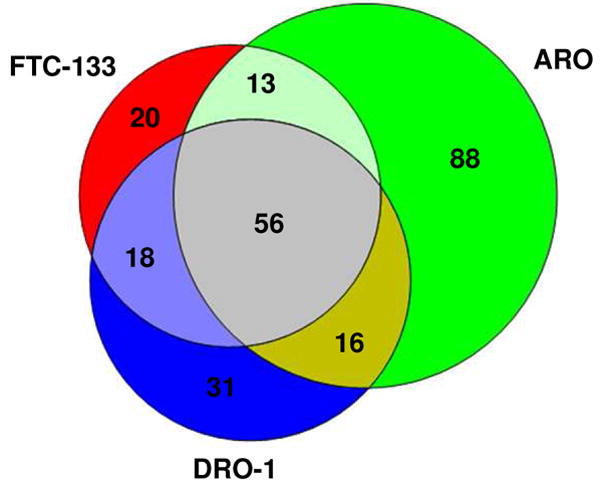
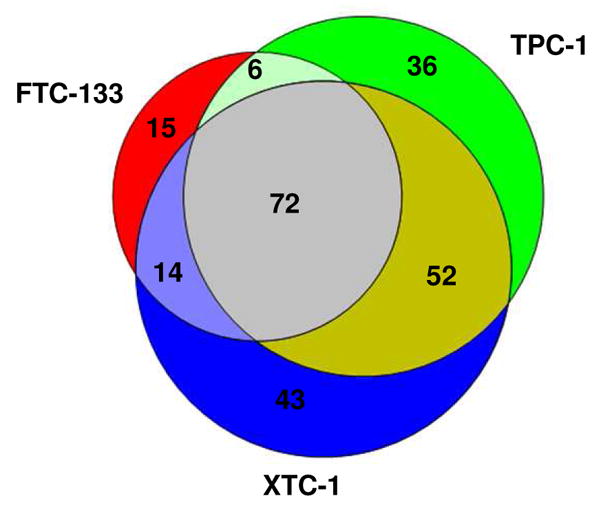
Figure 4A: Venn Plot of Glycoproteins Profiling of FCT-133, ARO and DRO-1 cells.
Figure 4B: Venn Plot of Glycoproteins Profiling of FCT-133, TPC-1 and XTC-1 cells
Official websites use .gov
A
.gov website belongs to an official
government organization in the United States.
Secure .gov websites use HTTPS
A lock (
) or https:// means you've safely
connected to the .gov website. Share sensitive
information only on official, secure websites.
Figure 4A: Venn Plot of Glycoproteins Profiling of FCT-133, ARO and DRO-1 cells.
Figure 4B: Venn Plot of Glycoproteins Profiling of FCT-133, TPC-1 and XTC-1 cells