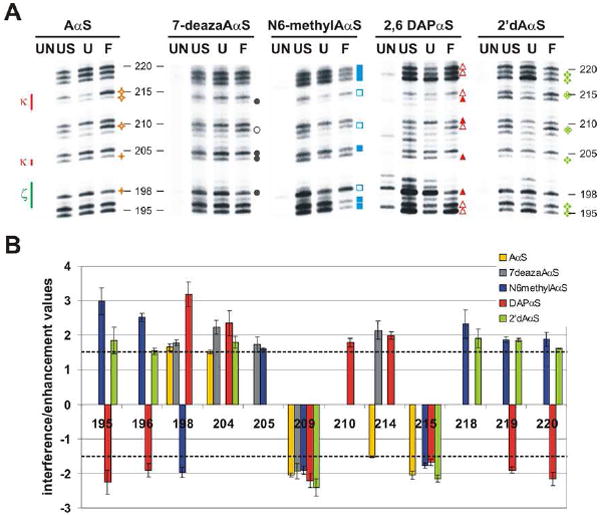
Figure 3. The D5 docking site in domain 1.

(a) Representative gels depict the 5’ regions of the D5 docking site comprising the κ–ζ element. For each gel lane 1 (UN) shows the background degradation of the labeled RNA, while lane 2 (US) represents the relative incorporation level for an analog at a specific position (RNA, which did not undergo the selection step, was iodine cleaved). Lane 3 (U) shows iodine cleavage products for RNA, which stems from the unfolded population purified from the native gel. Lane 4 (F) shows iodine cleavage products for RNA, which stems from the folded population eluted from the native gel. The NAIM effects of different backbone or nucleobase substitutions are shown in distinct colors: AαS or GαS analog (dark yellow), 7-deazaAαS (gray), N6-methylAαS (blue), DAPαS (red), 2’dAαS or 2’dGαS analogs (light green) and IαS (purple). Symbols used in this figure are explained in the legend to Figure 2. (b) Bar diagram displays the average value and standard deviation for each interference and enhancement found within the 5’ regions of the D5 docking site (except for G200). The dotted line indicates the cutoff below which interferences and enhancements were considered insignificant.
