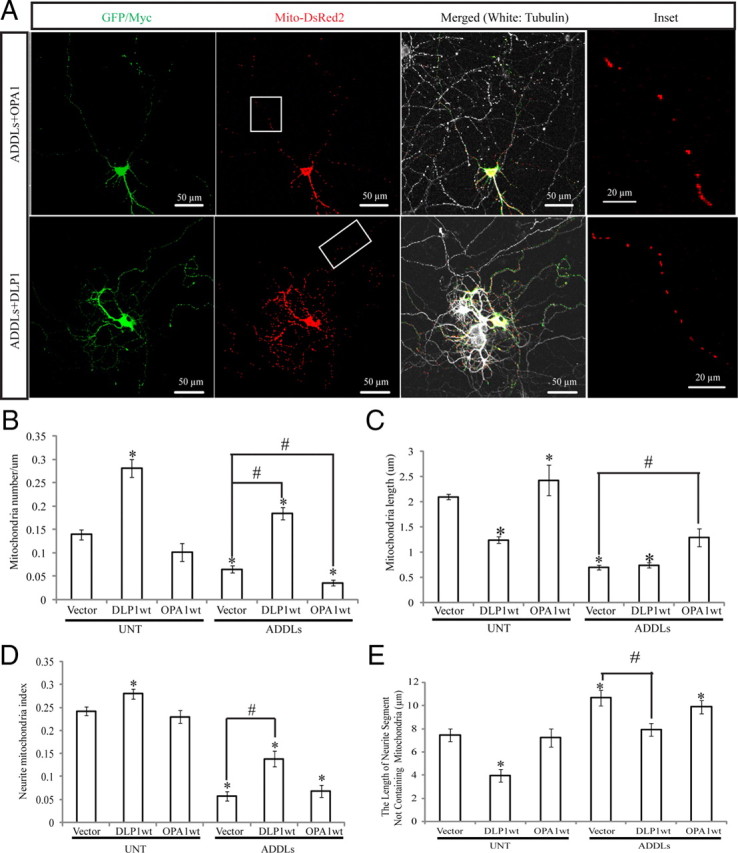
Figure 9.

Effects of DLP1 and OPA1 on ADDL-induced mitochondrial dynamics changes. A, Representative pictures of neurons (DIV 12) cotransfected with GFP-, Mito-DsRed2-, and Myc-tagged wild-type DLP1 or wild-type OPA1 after 24 h treatment with 800 nm ADDLs. Areas enclosed in white boxes are shown at higher magnification in Inset panels (right) to allow better appreciation of changes in mitochondrial morphology and density. Red, DsRed; green, Myc; white, Tubulin staining. B–E, Quantification of mitochondrial number (B), length (C), neurite mitochondrial index (D), and axial length of neurites not covered by mitochondria (E) in neurons with indicated treatment or manipulation (*p < 0.05, when compared with the nontransfected or empty vector-transfected normal control cells; #p < 0.05, when compared with control or empty vector-transfected cells with ADDL treatment; Student's t test). At least 20 neurons were analyzed in three independent experiments. UNT, Untreated.
