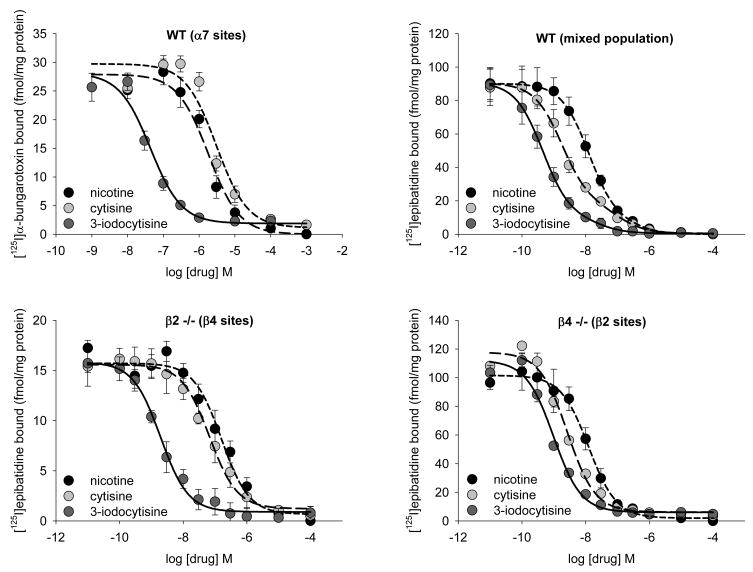
Figure 4. Inhibition curves for [125I]α-bungarotoxin and [125I]epibatidine binding.
Inhibition of 0.5 nM [125I]α-bungarotoxin binding in total membrane preparation from hippocampus of C57BL/6J mice (A). Data was fitted to a single site inhibition curve. Inhibition of 200 pM [125I]epibatidine binding in total membrane preparation from inferior colliculus of wilt-type (B), β2-/- (C) and β4-/- (D) mice. Data was fitted to a two site inhibition curve for wild-type samples and one site inhibition curve for the two null mutant mice.

