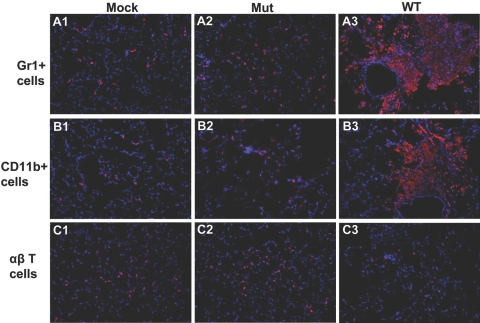
Figure 3.
Cellular infiltration in lungs of mice infected with the mutant is altered. Mice were infected intranasally with 3 × 10² CFUs of the WT or Mut bacteria in 20 μl PBS. Mock control mice received 20 μl PBS alone. At 72 h p.i., the lungs from mice were isolated and sectioned, and in situ IF staining was performed. (A1–A3) A purified rat anti-mouse Gr1 mAb (clone Ly-6G) and a RRX-conjugated Affipure goat anti-rat IgG were used to visualize the PMN cells. A1 represents Gr1+ cells in mock control mice; A2 shows the Gr1+ staining in Mut-infected mice, and A3 shows staining of Gr1+ cells in WT-infected mice. (B1–B3) CD11b+ myeloid cells (red) were visualized using an R-PE-conjugated CD11b mAb. B1 shows CD11b+ cells in mock lung; B2 and B3 represent CD11b+ staining in Mut- and WT-infected lungs, respectively. (C1–C3) R-PE-conjugated anti-mouse αβ TCR-β chain mAb was used to stain αβ T cells (red). C1 displays αβ T cells in mock animals, and C2 and C3 represent αβ T cell staining in Mut- and WT-infected mice lungs, respectively. Nuclei (blue) were stained with 4′6′-diamidino-2-phenylindole-dilactate. Images are from one representative experiment of three performed (n=3–4 mice/group for each experiment). Original magnification, ×200.

