Figure 4.
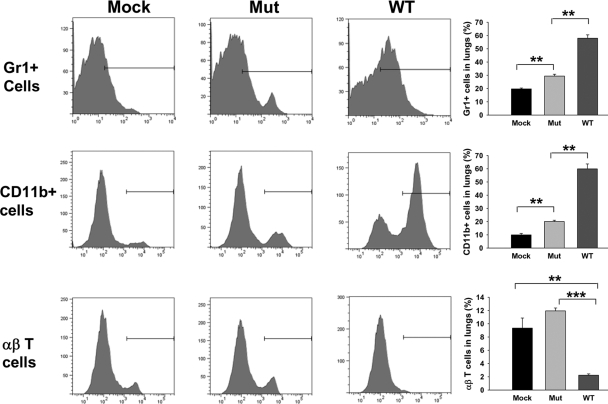
Flow cytometry analysis of cellular infiltrates in Mut- and WT-infected lungs. Lung cells were isolated by collagenase treatment from mock control mice and mice infected intranasally with 3 × 10² CFUs of the WT or Mut bacteria at 72 h p.i. The cells were stained with (top row) anti-Gr1-APC; (middle row) anti-CD11b-PE, or (bottom row) anti-αβ TCR-β chain-PE. Appropriate isotype-matched negative controls were used to set the gates. The positively stained cells were expressed as percent of total lung cell population. Total number of lung cells (×106) in this representative experiment was 6.66 ± 0.88 in mock, 7.5 ± 2.84 in Mut-infected, and 10.66 ± 1.33 in WT-infected animals. An average of percent positive cells from three mice from a representative of three experiments is shown. **, P < 0.005; ***, P < 0.0001.

