Figure 6.
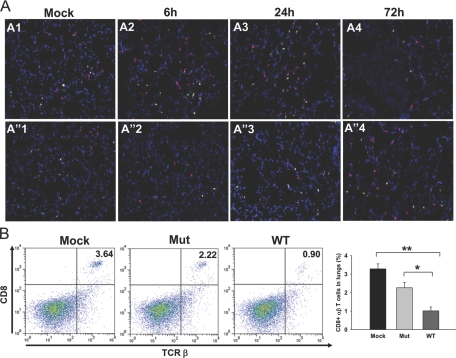
Infiltration of CD8+ T cells in lungs after infection with Mut or WT bacteria. In situ IF staining was performed on frozen lung sections from mock control or mice infected intranasally with 3 × 10² CFUs of the WT or Mut bacteria at 72 h p.i. The sections were stained with anti-αβ TCR-β chain-PE (red) and anti-CD8 followed by Alexa-488-conjugated secondary antibody (green). (A, A1 and A”1) Mock control mice. (A, A2–A4) Lungs from mice infected with WT at 6, 24, and 72 h p.i., respectively. (A, A”2–A”4) Lungs from Mut-infected mice at 6, 24, and 72 h p.i., respectively. Representative images are from two independent experiments, each with three to four mice. Original magnification, ×200. (B) Lung cells from mock and Mut- and WT-infected mice were analyzed for CD8+ αβ T cells by FACS at 72 h p.i. The cells were stained simultaneously with anti-αβ TCR-β chain-PE and anti-CD8-Alexa-647. Lung cells stained singly for αβ TCR-β chain or CD8 were used to set the gates. The double-positive cells are expressed as percent of total lung cell population. Total number of lung cells (×106) in this representative experiment was 5.70 ± 1.27 in mock, 8.7 ± 0.76 in Mut-infected, and 11.83 ± 0.49 in WT-infected animals. An average of percent positive cells from three mice from a representative of two experiments is shown. *, P <0.05; **, P < 0.005.

