Fig. 4.

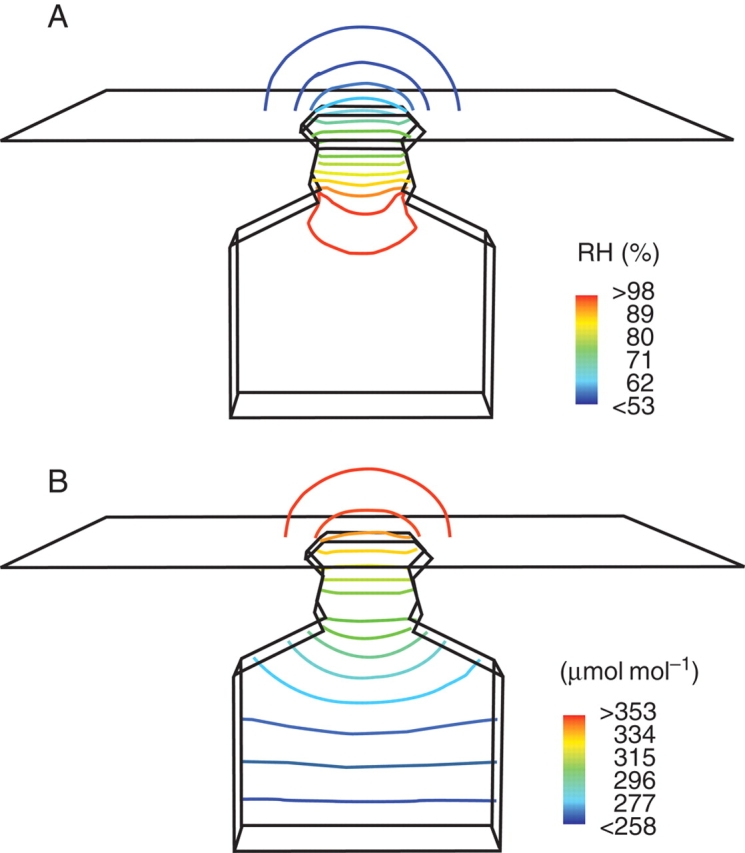
Concentration gradient inside the model BASIC, plotted as contour lines into a cut plane of the model: (A) contour lines of water vapour, (B) contour lines of CO2.

Concentration gradient inside the model BASIC, plotted as contour lines into a cut plane of the model: (A) contour lines of water vapour, (B) contour lines of CO2.