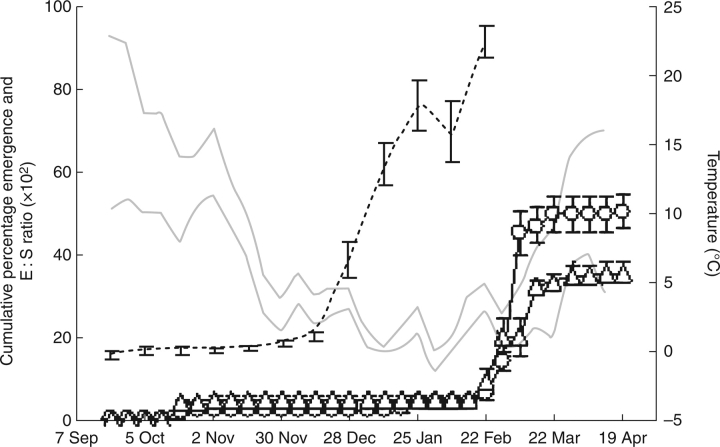
Fig. 1.
Cumulative percentage of seedling emergence and phenology of embryo growth of C. temulum in natural conditions. Grey lines are mean weekly maximum and minimum temperature at 1 cm depth. Dotted line, embryo growth (n = 20); open circles, germination of seeds at the soil surface (n = 3); open triangles, germination of seeds buried at 1 cm depth (n = 3). Vertical bars represent the s.e. for embryo growth and the s.d. for seedling emergence.

