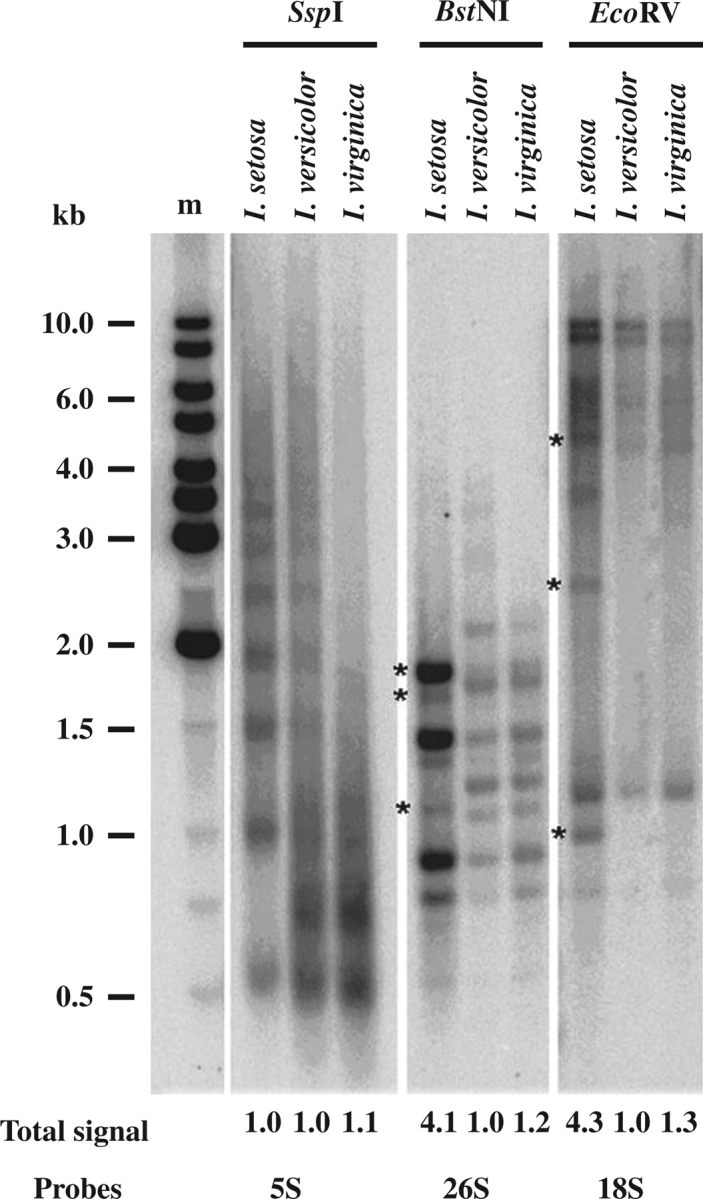
Fig. 1.

Southern restriction digests of I. setosa, I. versicolor and I. virginica with enzymes SspI, BstNI, EcoRV and probed with 5S, 26S and 18S rDNA, respectively. The total signal reflects the relative copy numbers of rDNA units, calculated by dividing the signal intensity in each lane by the intensity from the species with the lowest signal. Asterisks indicate bands of I. setosa-origin that are lost or reduced in the allopolyploid.
