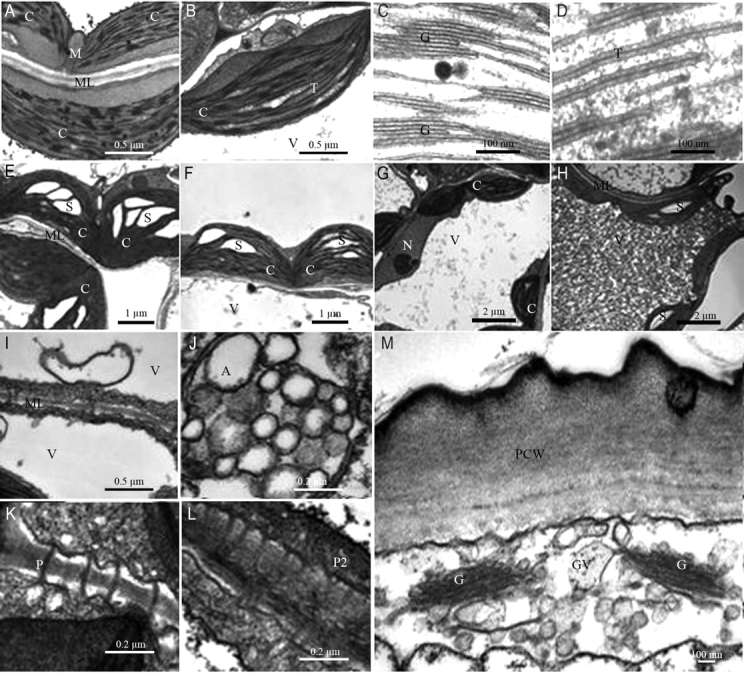
Fig. 6.

Chloroplasts of (A) Ler and (B) elo1 cells under standard conditions. Chloroplast thylakoids of Ler (C) and elo1 (D). Chloroplasts of Ler (E) and elo1 (F) plants grown on 2 % sucrose medium, showing a strong starch accumulation in the stroma. elo1 cells of plants grown on 0·5 % (G) and 2 % (H) sucrose concentration medium. Autophagy in Ler (I) cells grown under sucrose starvation and elo1 (J) cells grown under standard conditions. Plasmodesmata of elo1 cells of plants grown under standard conditions (K) and in sucrose abundance (L). (M) Golgi of elo1 cells of plants grown under standard conditions. Magnifications: (A, B, I) 20 000 ×; (C, D) 85 00 ×; (E, F) 7000 ×; (G, H) 4400 ×; (J–L) 50,000 ×; (M) 30 000 ×. C, chloroplast; M, mitochondrion; N, nucleus; S, starch; ML, median lamella; V, vacuole; A, autophagic products; P, simple plasmodesma; P2, Y plasmodesma; G, Golgi apparatus; GV, Golgi vesicles; PCW, primary cell wall.
