
Fig. 2.
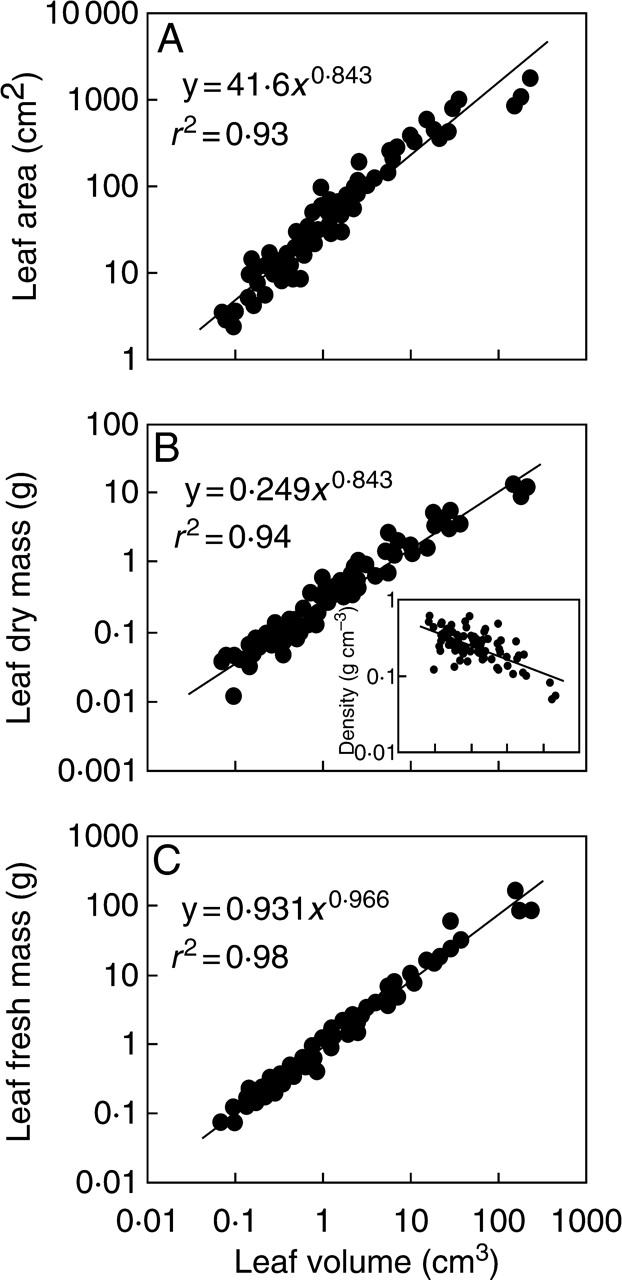
Leaf area (A), dry (B) and fresh mass (C) in relation to leaf volume in all studied species. The inset in (B) demonstrates the correlation between leaf density (dry mass per unit volume) and leaf volume (y = 0·251x−182, r2 = 0·44). Leaf size estimates refer to whole leaf, i.e. lamina with mid-rib and petiole. Log–log-transformed data were fitted by standardized major axis regressions using SMATR 2·0 (SMATR, Standardised Major Axis Tests & Routines by D. Falster, D. Warton & I. Wright, http://www.bio.mq.edu.au/ecology/SMATR) (for details see Warton et al., 2006). All regressions are significant at P < 0·001. 95 % confidence intervals for the scaling exponent (regression slope in log–log axes) were 0·802 and 0·886 for A, 0·798 and 0·891 for B, and 0·935 and 0·999 for C.