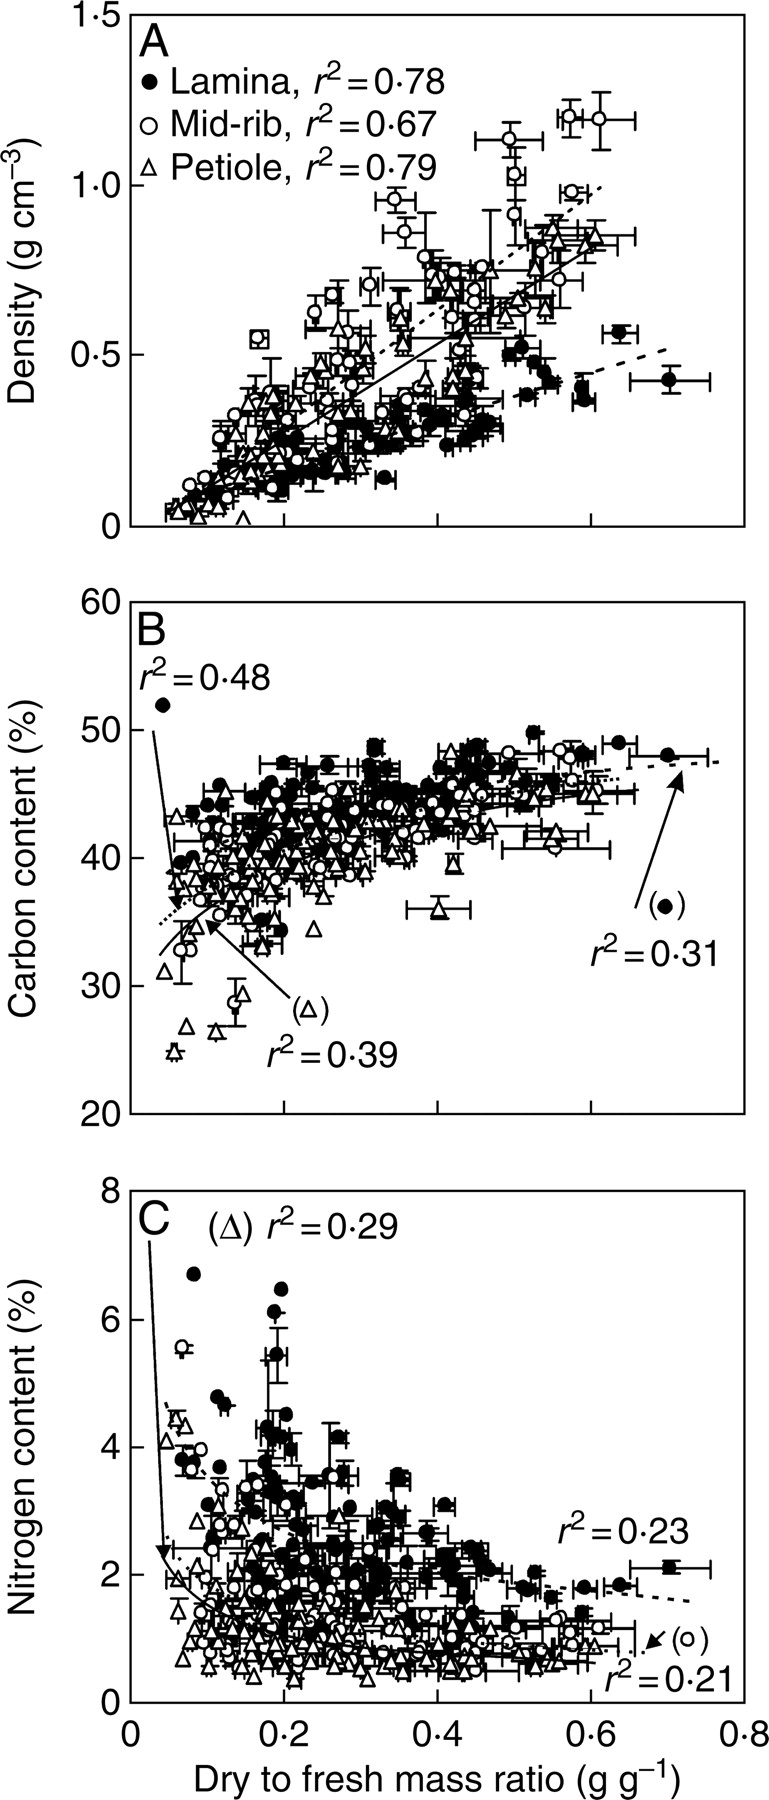
Fig. 4.

Density (A), and carbon (B) and nitrogen (C) percentages of lamina without mid-rib (dashed line), mid-rib (dotted line) and petiole (solid line) in relation to dry to fresh mass ratio of these leaf fractions. Data presentation and species as in Fig. 3. Linear (A) or non-linear regressions in the form y = axb were fitted to the data. All regressions are significant at P < 0·001.
