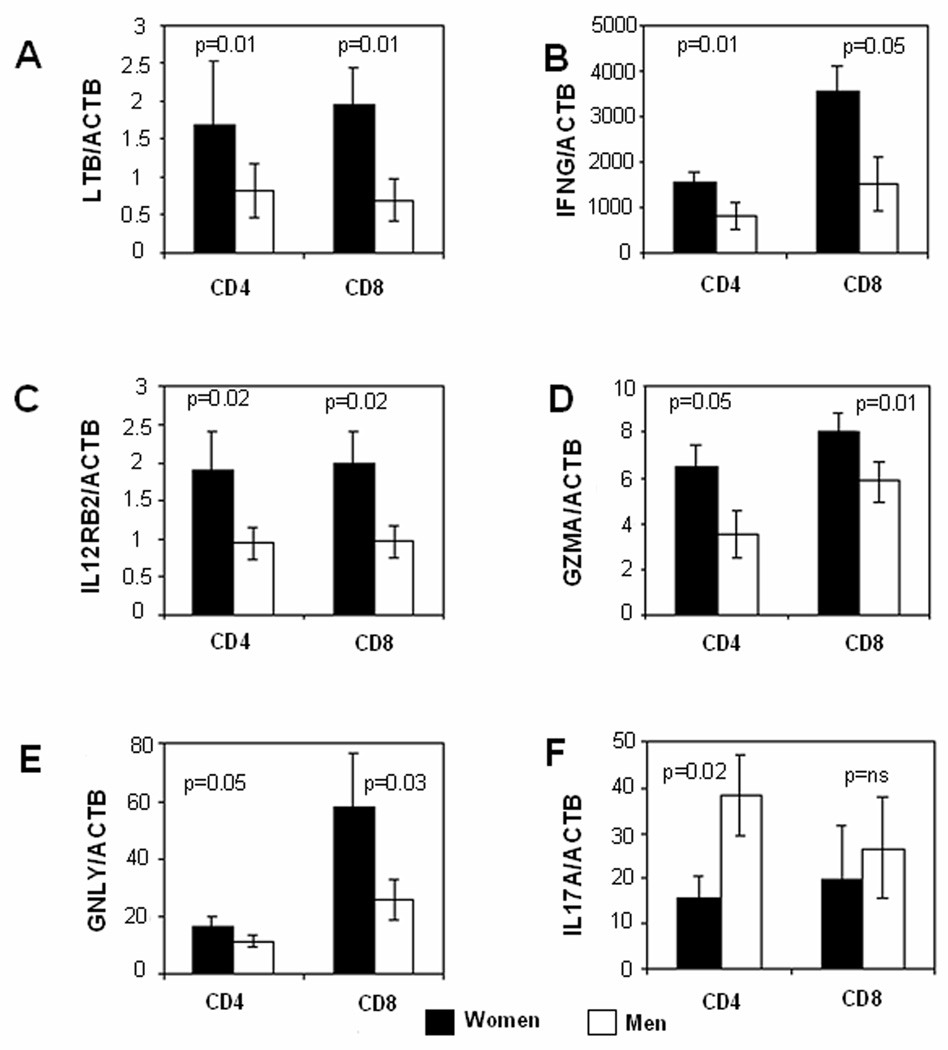
FIGURE 2. Expression levels of pro-inflammatory transcripts in restimulated T cells from men and women.
PBMC from 10 racially matched male-female pairs were stimulated with PHA, cultured 4 days, then restimulated for 6 hours with PMA + ionomycin. CD4+ and CD8+ T cells were isolated and expression levels of (A) LTB, (B) IFNG, (C) IL12RB2, (D) GZMA, (E) GNLY and (F) IL17A were measured by qRT- PCR relative to β-actin. Results are presented as the mean±SEM of the 10 determinations per group. Dark bars represent transcript levels in the women, and light bars transcript levels in the men.

