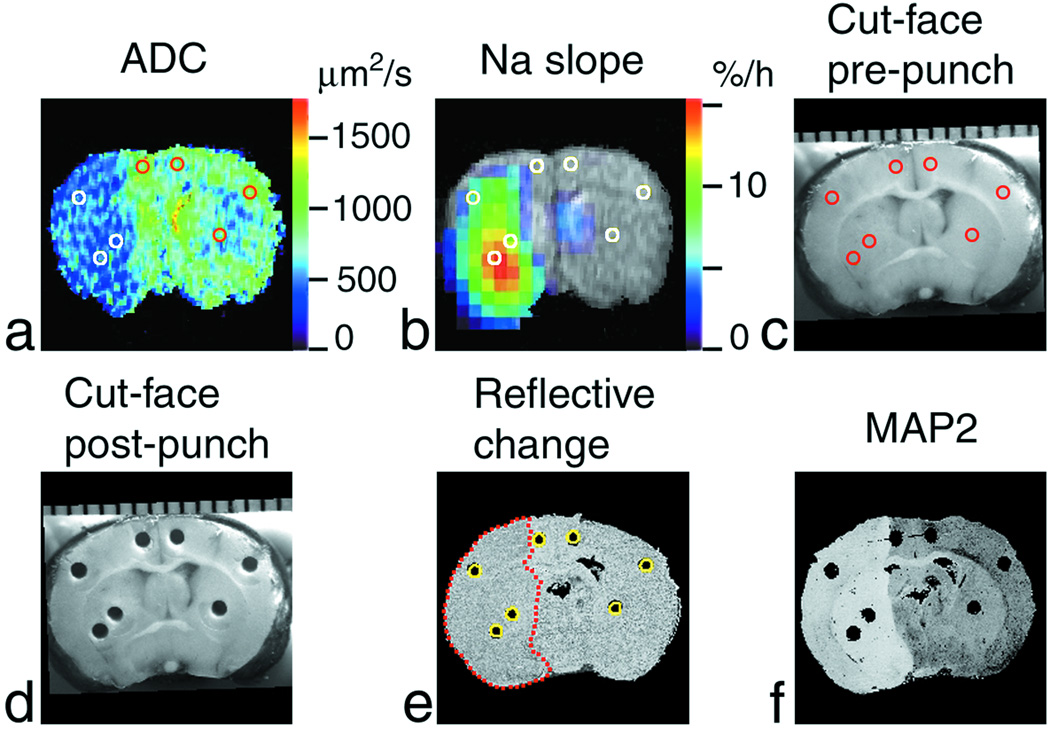
Figure 1.
Region-of-interest (ROI) analysis of Na+ accumulation and ADC deficit in a rat brain after MCAO. Coronal images of the brain (at approximately bregma – 0.4 mm) of the rat #6 are shown. (a) ADC map where ADC < 500 µm2/s in the ischemic area (left-hand side of the image). (b) Pseudocolor-coded parametric image of the rate of 23Na signal increase (‘slope’) superimposed over the grayscale 1H spin-echo MR image as an anatomic reference. (c) Cut-face photograph of the brain in the cryostat before sampling and (d) after sampling showing punch holes. A millimeter scale is shown at the top. (e) Cross-section of the 3D reconstruction of the brain from the 40-µm-thick slices cut at 4.4 h post MCAO. The change in surface reflectivity of ischemic tissue shows the infarct location (outlined by a red dotted line). Cylindrical ROIs (yellow circles) were placed over the punch holes. (f) The absence of staining in the MAP2-stained slice indicates the ischemic lesion. Reference tubes with NaCl solutions were external to the rat head in the magnet and are not shown in MR images. ROIs defined in (e) by their correspondence to the punch positions are shown in images (a–c) as white or colored circles. The images were aligned and analyzed using AMIDE software. Punch samples were analyzed using emission flame photometry.

