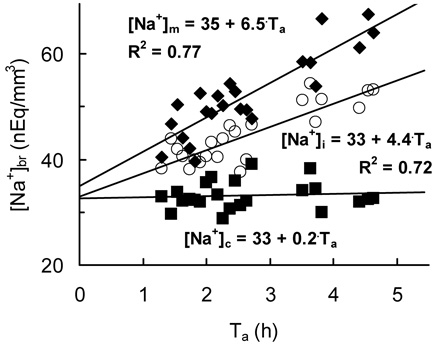
Figure 2.
Na+ accumulation in a typical ischemic brain monitored by 23Na MRI. [Na+]br and corresponding linear regressions are shown for the ROIs in ischemic cortex ([Na+]i, circles), homotopic normal cortex ([Na+]c, squares), and the site of the maximum slope ([Na+]m, diamonds) in the rat #5. Ta, time after MCAO.

