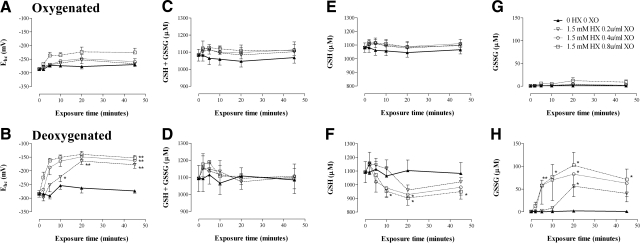
Figure 4.
Serial glutathione redox state of deoxygenated and oxygenated RBCs exposed to graded oxidative stress. Measurement of total glutathione (GSH+GSSG) and GSSG alone and calculation of GSH (from the difference) in oxygenated or deoxygenated washed RBCs exposed to HX/XO. Glutathione-related parameters, including half-cell reduction potential Ehc (A, B), total GSH + GSSG (C, D), GSH alone (E, F), and GSSG alone (G, H) are shown for oxygenated RBCs (top panels) and deoxygenated RBCs (bottom panels). Data are presented as means ± se; n = 4–6. *P < 0.05, **P < 0.01 for deoxygenated RBCs vs. corresponding oxygenated RBC sample. Note that P < 0.01 for all 0.4 and 0.8 U/ml XO deoxygenated RBC Ehc values from 5 min onward, vs. corresponding oxygenated RBC Ehc (not presented graphically).

