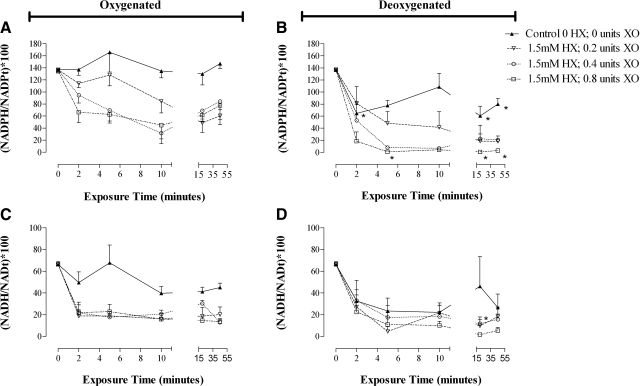
Figure 6.
Serial NADPH and NADH redox ratios from oxygenated and deoxygenated RBCs exposed to graded oxidative stress. NADPH/NADP (A, B) and NAD/NADH (C, D) redox ratios calculated from the measurement of total and reduced pyridine nucleotides. Change in the (NADPH/NADPTotal) × 100 ratio over time during steady oxidant production reflects recycling efficiency for the NADPH-reducing systems in RBCs. Data are presented from oxygenated (A, C; left panel) and deoxygenated (B, D; right panel) RBCs. Data are plotted as means ± se; n = 3–6. *P < 0.05, **P < 0.01 for deoxygenated RBC samples vs. corresponding oxygenated sample.

