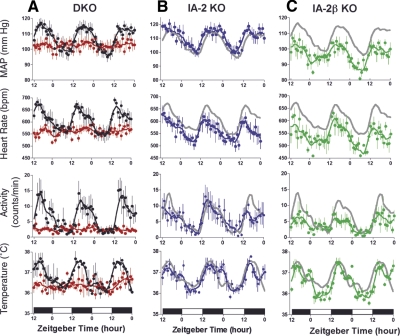
Figure 1.
Mean arterial pressure (MAP), heart rate, spontaneous physical activity, and body temperature in WT and KO mice. A) WT (black) and DKO mice (red). B) IA-2 KO mice (blue). C) IA-2β KO mice (green). Gray lines in B and C represent WT data from A. Data represent means ± se of 5 to 8 mice/group, where the value for each mouse is the hourly average of 10-s recordings taken every 2 min. Mice were maintained in a 12-h light-dark (LD) lighting cycle, and data were collected continuously for 60 h. Zeitgeber times 0 and 12 correspond to lights on at 6:00 AM and lights off at 6:00 PM, respectively. Lines represent data smoothing using the weighted average of the 9 nearest points.

