
Figure 5.
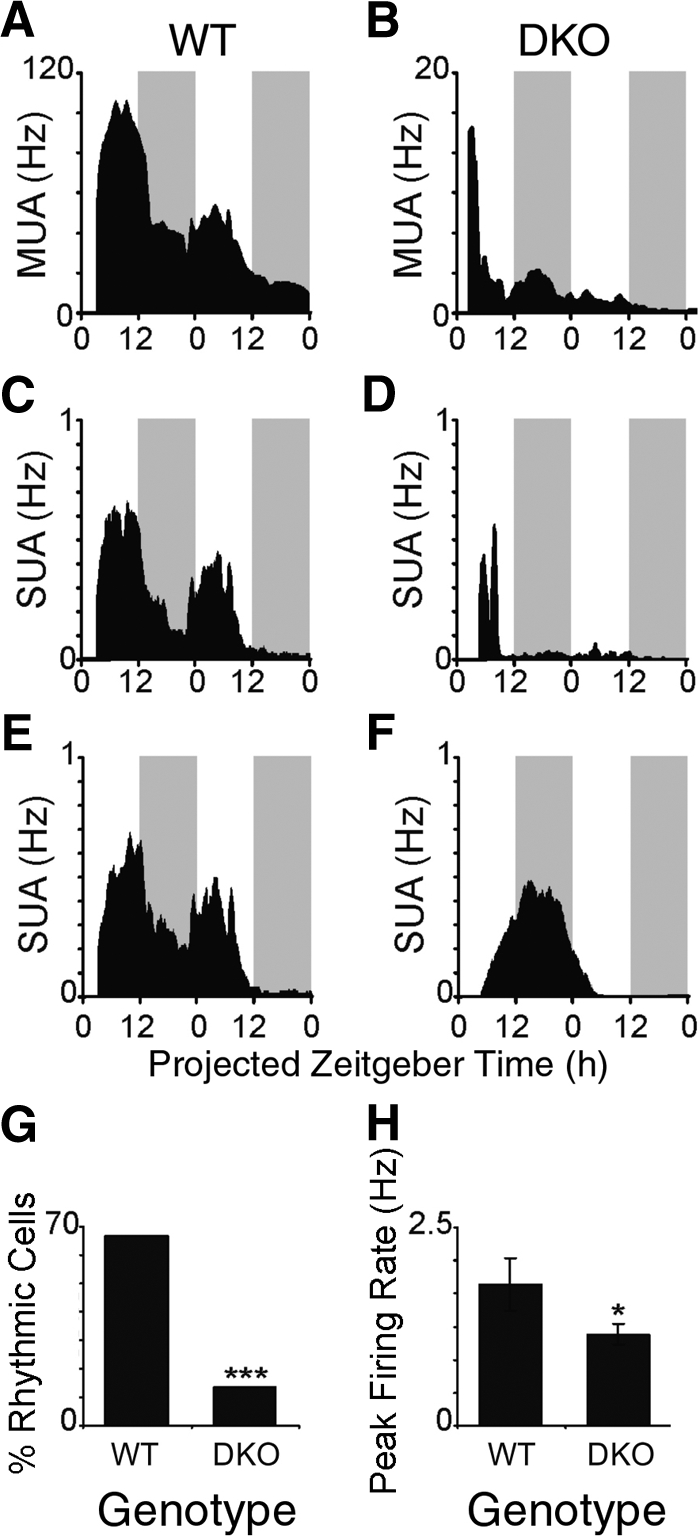
Neuronal firing rate rhythms are disrupted in the SCN of DKO mice. WT mice show clear rhythms in MUA (A) and SUA (B, C), whereas DKO mice show blunted or arrhythmic MUA (D) and SUA profiles (E, F). Firing rate traces show the average firing rate each minute from a representative slice, smoothed using a 1-h moving average. Shaded gray bars represent the projected lights-off period. In contrast to the neurons (n=15) from the WT mice, the percentage of rhythmic neurons (G) and the peak firing rate (H) of neurons (n=22) from DKO mice are significantly reduced. *P < 0.05; unpaired t test. ***P < 0.001; χ2 test.