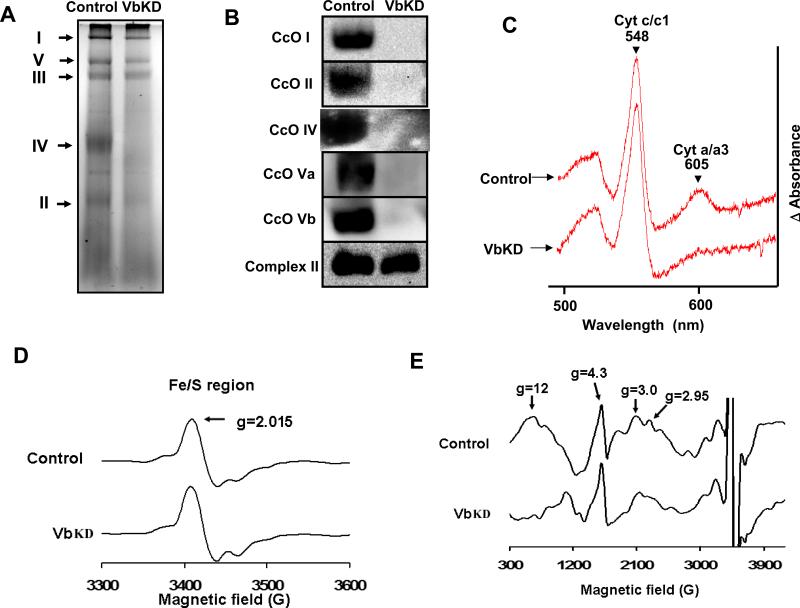
Figure 2. Silencing of subunit Vb leads to loss of CcO.
A, 100 μg of mitochondrial extract was separated using 6-13% BN-PAGE and stained bands were visualized, B, 150 μg of mitochondrial protein was resolved on BN-PAGE as in A and transferred to PVDF membrane and probed with monoclonal antibodies for CcO I, CcO II, CcO IV, CcO Va, CcO Vb proteins. Complex II was used as loading control. C. 800 μg of mitochondrial protein solubilized with 2% lauryl maltoside was used for spectral analysis. The reduced-minus oxidized difference spectra was recorded and analyzed for the a/a3 specific peak at 605 nm and the cytochrome c/c1 peak at 548 nm. D. X-band EPR of the normal and VbKD cells were measured at 10 K using 5 mW microwave power as described in Materials and Methods. D show the Fe/S cluster and E shows the heme a, and heme a3/CuB binuclear center of CcO respectively.

