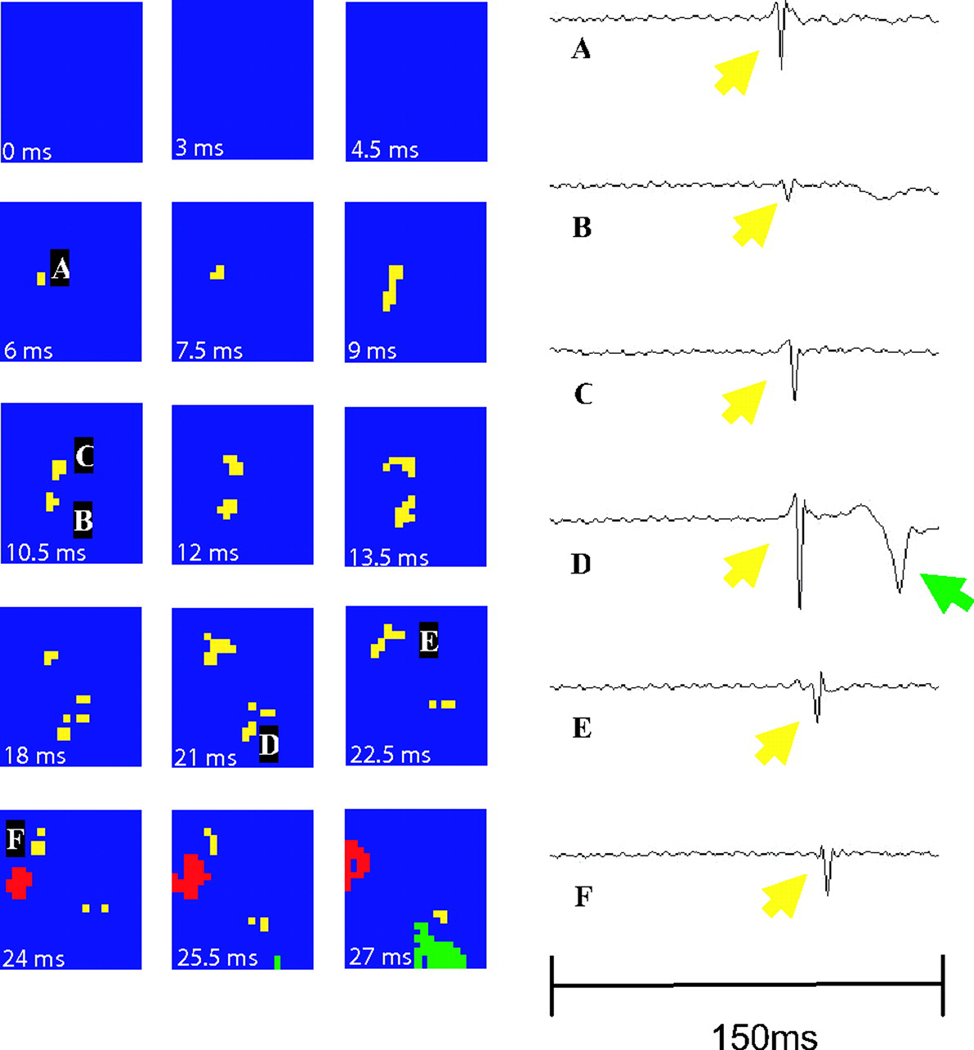
Figure 7.
A focal activation arising from the center of the array. The focal appearing PF activation (yellow) is followed by a WVM (red) activation wavefront. The temporal derivative of individual electrode recordings shows the wavefront initiating at electrode A and spreading outward toward electrodes D and E. The green represents a non-related wavefront. Reprinted with permission.40

