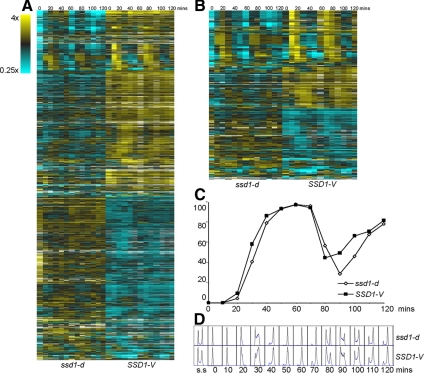
Figure 1.
Differentially expressed genes between cells carrying ssd1-d versus SSD1-V. (A) Heat map of BY2125 (ssd1-d) and BY4260 (SSD1-V) microarray data through two cell cycles showing the 889 differentially expressed genes identified by DiffExp. Each column represents one time point. Each row represents a gene. (B) Heat map of BY2125 and BY4260 microarray data showing the 227 cell cycle regulated genes that are differentially expressed in cells carrying ssd1-d versus SSD1-V. (C) Progress through the cell cycle was monitored by budding index and (D) DNA synthesis from 0 min to 120 min after alpha factor release. ssd1-d, ◇; SSD1-V, ■.

