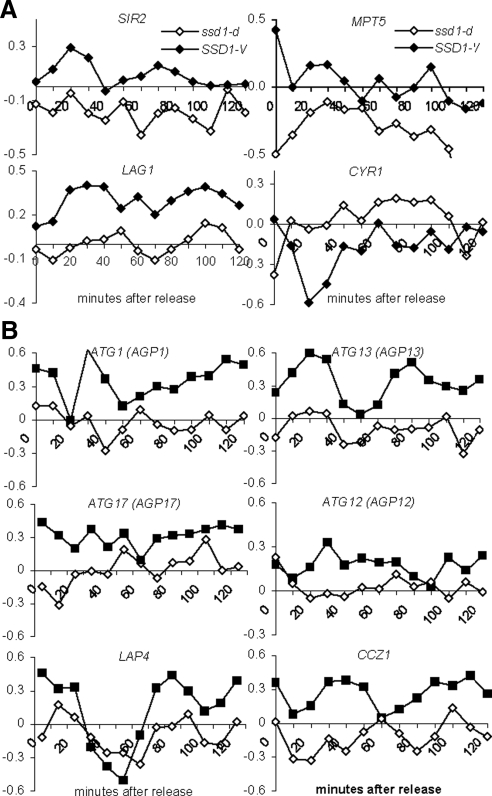
Figure 4.
Differentially expressed transcripts that affect the life span extension of yeast cells are affected by SSD1-V (closed symbols) versus ssd1-d (open symbols). Log2 ratios for each time point plotted using the transcript level in asynchronous populations as the denominator. (A) Microarray expression profiles of four transcripts that influence the RLS are affected in SSD1-V versus ssd1-d. (B) Microarray expression profiles of the six transcripts that influence autophagy that are up-regulated in SSD1-V versus ssd1-d.

