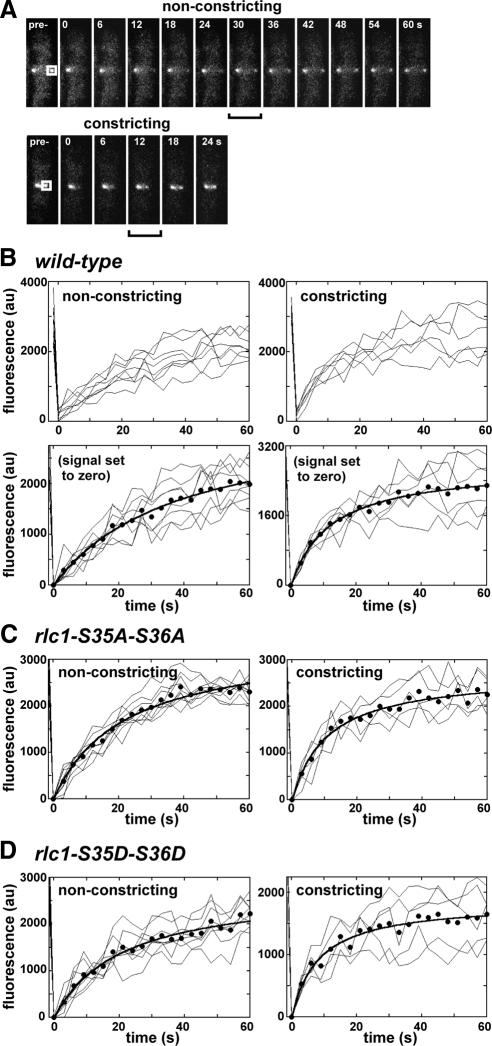
Figure 5.
The rate of Myo2p exchange in the contractile ring increases during constriction. FRAP was used to measure YFP-Myo2p exchange rates in nonconstricting and constricting contractile rings using confocal laser scanning fluorescence microscopy. Cells were grown in YE5S media at 25°C before imaging at ambient temperature. (A) Micrographs charting recovery of YFP-Myo2p fluorescence in nonconstricting (top) and constricting (bottom) rings from representative rlc1+ cells. Panels on the far left show prebleached rings that were subsequently bleached at a region of interest (ROI, white box). Subsequent panels chart recovery of signal at the ring (0–60 s). Brackets indicate the point when recovery is half-maximal (t1/2). Panel width: 5 μm. (B–D) Plots charting fluorescence intensity versus time for ROIs on nonconstricting and constricting rings from rlc1+, rlc1-AA, and rlc1-DD cells. Fluorescence intensities measured before (−1.5 s) and after photobleaching (every 3 s, 0–60 s) are plotted. Individual ROI traces (thin lines) are shown (n = 5–10) along with an average fit (●, thick line). Datasets for each trace were corrected for additional bleaching encountered during time-lapse imaging by a control ROI (derived from an unbleached ring in the same field of cells). To facilitate curve fitting, zero signal intensity was set for each trace by subtracting residual YFP-Myo2p signal (detected at the ROI at the first time point after bleach, 0 s) from all trace values. Examples of datasets lacking this correction are provided for experiments with the rlc1+ strain (B, top panels).

