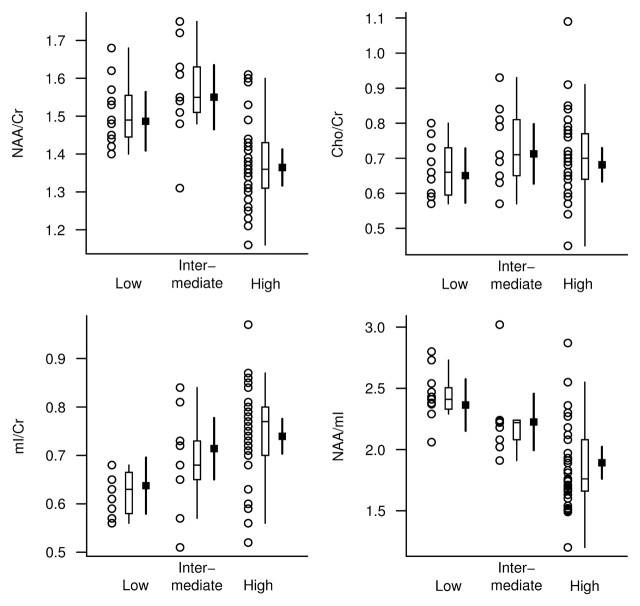
Figure 2:
1H MR spectroscopic metabolite ratios plotted according to pathologic diagnosis of AD likelihood (horizontal axis) based on NIA-Reagan criteria. For each AD likelihood diagnosis, individual values, a box plot of the distribution, and the estimated mean and 95% confidence interval (CI, darker lines) for the mean are shown. The mean and CI were derived from ANCOVA models and are assumed for a 78-year-old woman in whom the interval from 1H MR spectroscopy to death is 2 years.

