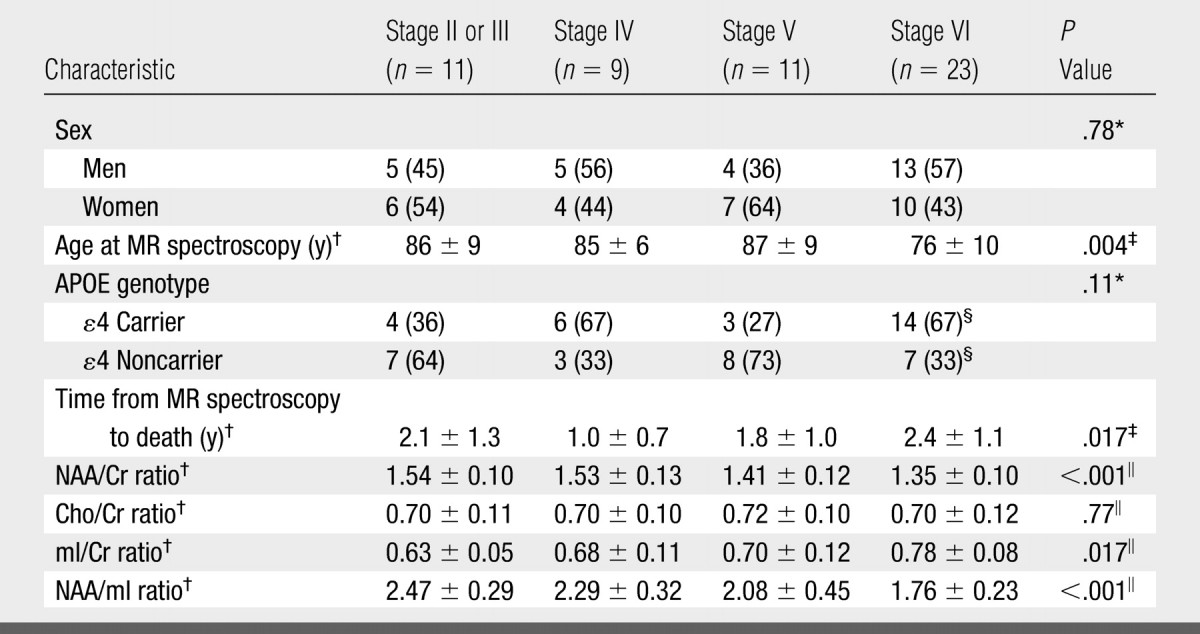
Table 3.
Clinical, MR Spectroscopy, and Demographic Characteristics in NFT Stage Groups

Note.—Unless otherwise noted, data are numbers of patients grouped according to Braak NFT stage, with percentages in parentheses. APOE = apolipoprotein E.
Calculated by using Fisher exact test.
Mean value ± standard deviation.
Calculated by using one-way analysis of variance.
Percentages are based on group total of 21 patients.
Calculated by using ANCOVA.
