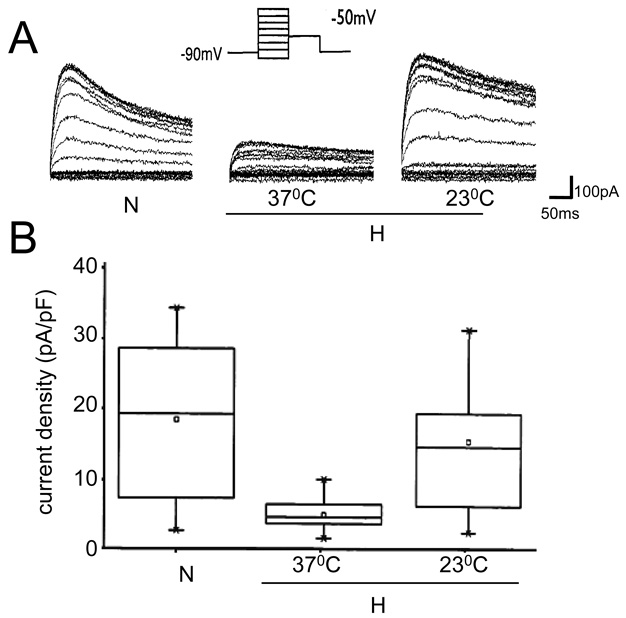
Fig 2. hERG current measurements in cells exposed to hypoxia at different temperatures.
A. Representative traces of hERG currents recorded from a control cell and a cell exposed to hypoxia at 37°C or 23°C. B) Current densities derived from cells exposed to normoxia (n=15), hypoxia at 23°C (n=11) and at 37°C (n=12), as described in methods. To give a measure of data dispersion, data are presented in box charts, whiskers marking the 5th and 95th percentile and the box determining the 25th and 75th percentile. Arithmetic means are represented by open squares.

