
Table 2.
OP-Lysine Characteristic Ionsa
| Mass amub | Name | Structure | Per Centc | Rel Intensed |
|---|---|---|---|---|
| Chlorpyrifos-oxon | ||||
| 21 tryptic peptides analyzed | ||||
| 220.0 | diethoxyphospho Lys immonium minus NH3 | 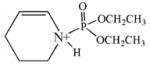 |
95 | 6–100 |
| 192.0 | monoethoxyphospho Lys immonium minus NH3 | 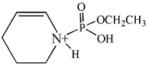 |
85 | 4–38 |
| 163.9 | phospho Lys immonium minus NH3 | 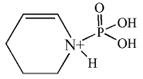 |
75 | 5–26 |
| 128.9 | α-amino caprolactam |  |
30 | 4–13 |
| 129.9 | Pipecolic acid |  |
10 | 10–15 |
| 83.9 | Lys immonium minus NH3 | 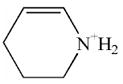 |
50 | 4–27 |
| 237.1 | diethoxyphospho Lys immonium | 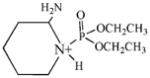 |
50 | 3–18 |
| 237 | monoethoxyphospho α-amino caprolactam | 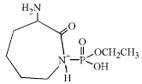 |
-- | -- |
| 209.1 | monoethoxyphospho Lys immonium | 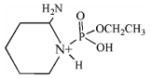 |
10 | 2–5 |
| Diisopropylfluorophosphate | ||||
| 1 tryptic peptide analyzed | ||||
| 164.0 | phospho Lys immonium minus NH3 | 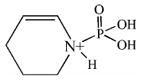 |
100 | 42 |
| 181.2 | phospho Lys immonium | 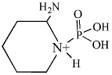 |
100 | 8 |
| 8\ | Lys immonium minus NH3 | 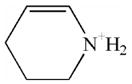 |
100 | 8 |
a
All masses are for the protonated, dehydro form of the amino acid.
b
Masses are given as the average of all measurements.
c
“Per Cent” refers to the fraction of the tryptic peptides that exhibited this mass.
d
“Rel Intense” refers to the intensity of the mass relative to the most intense peak in the MSMS spectrum. This value is generally given as a range, in percentage. Entries without a range represent masses which appeared only once.