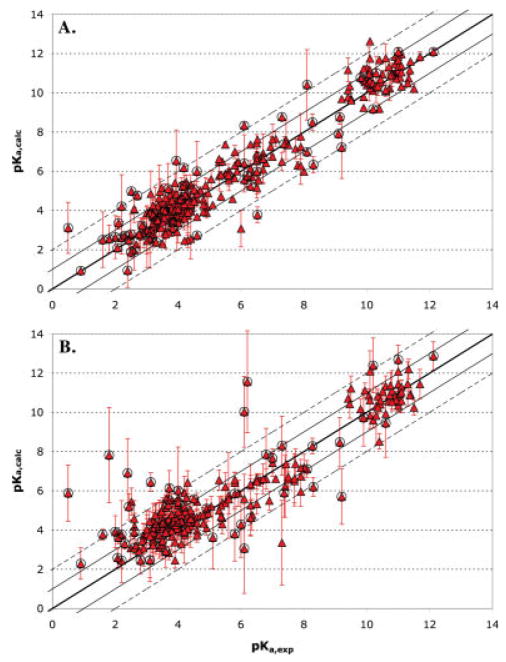
Figure 3.
Comparison of calculated pKa values using FULL MCCE conformer flexibility with experimentally measured values. The error bars represent the standard deviation of the values for different structures. The thick central line is the ideal where pKa (calc) = pKa (expt); the solid line bracket errors <1 pH unit and the dashed lines errors <2 pH units. Circled points highlight residues buried in the protein with desolvation energies >2.04 kcal/mol (1.5 pH units) or with pKas perturbed by >1.5 pH units from the solution value. (A) 305 averaged pKas obtained starting with 86 structures obtained by X-ray crystallography of 33 proteins; (B) 265 pKas obtained starting with 696 structures obtained by NMR methods of 24 proteins. The calculated and experimental pKas are provided in supporting information Table S2.

