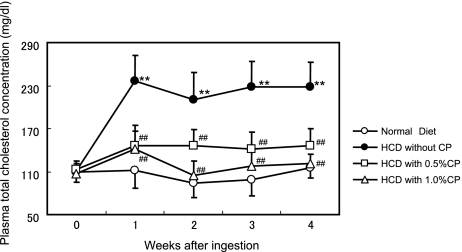
Fig. 1.
Changes in levels of plasma total cholesterol in rats fed on the experimental diet. Values are presented as the mean and standard deviation. Open circle; normal diet, closed circle; high cholesterol diet, open square; 0.5% CP-containing HCD diet, open triangle; 0.5% CP-containing HCD diet. Significantly different from the Normal Diet, ** p<0.01. Significantly different from the HCD without CP, ## p<0.01.

