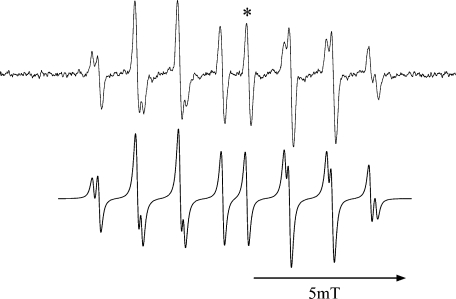
Fig. 1.
ESR spectrum of OH radical adduct of CYPMPO (top). OH radical was produced with 5 s UV illumination to 10 mM H2O2 phosphate buffer (50 mM) solution. ESR spectrum was recorded immediately after the illumination was ceased. ESR spectrometer settings were: field modulation width 0.1 mT; microwave power 8 mW; field scan width/rate 15 mT/2 min; time constant 0.1 s. The intensity of the line marked with * was adopted as a measure for the adduct concentration. The bottom chart is a computer simulated ESR spectrum using hyperfine coupling constants; Isomer 1: AN = 1.37 mT, AH = 1.37 mT, AP = 4.88 mT; Isomer 2: AN = 1.25 mT, AH = 1.23 mT, AP = 4.70 mT.

