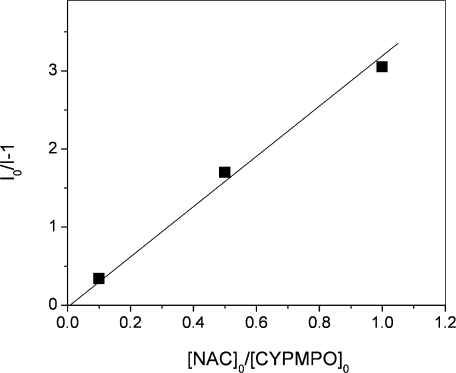
Fig. 3.
A plot of (I0 – I)/I, where I0 and I denote ESR intensity in the absence and presence of NAC, respectively, against [AOx]0/[ST]0, where [AOx]0 and [ST]0 denote the initial concentrations of NAC and CYPMPO, respectively. The slope of the zero-crossing line represents the ratio of scavenging rate constants k2/k1.

