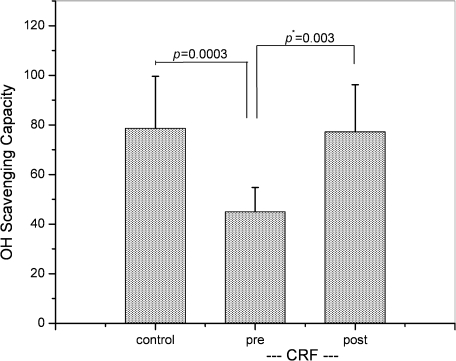
Fig. 5.
A graph for mean values of OH radical scavenging capacity for control and pre-HD/post-HD CRF groups with error bars (SD). Post statistical test for the difference with unpaired Student’s t test indicated that the difference between control and pre-HD groups was significant (p = 0.0003). The difference between pre-HD and pos-HD was analyzed with paired Student’s t test and also significant (p* = 0.003).

