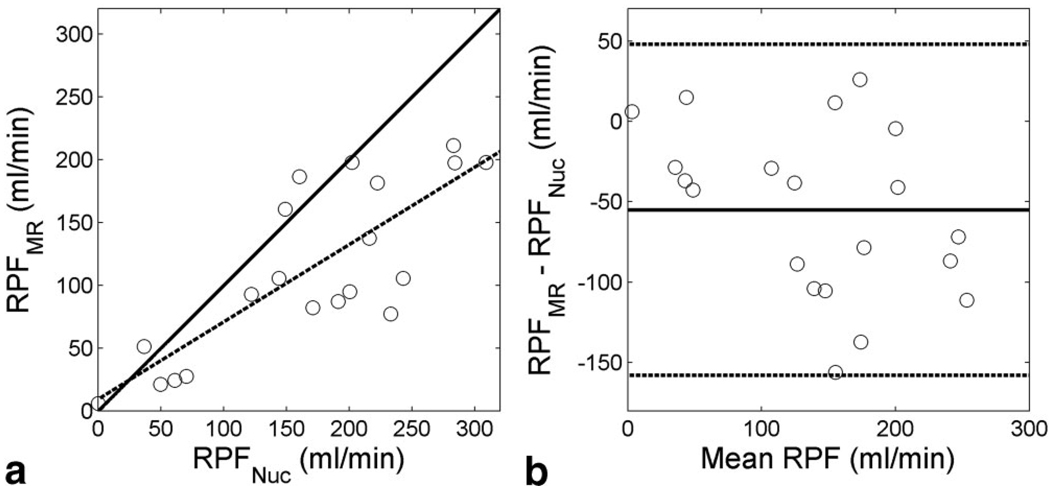
FIG. 5.
Comparison of RPF values determined by the proposed model fitting (RPFMR) and those by nuclear medicine (RPFNuc). a: Correlation plot: regression line y = 0.62 × + 9.3, correlation coefficient r =0.80. The solid line is the identity line, and the dotted line is the linear regression. b: Bland-Altman plot of the same data. The difference averages −55.0 mL/min (solid line) with ± 1.96 SD between −158.1 mL/min and 50.0 mL/min (dotted lines).

