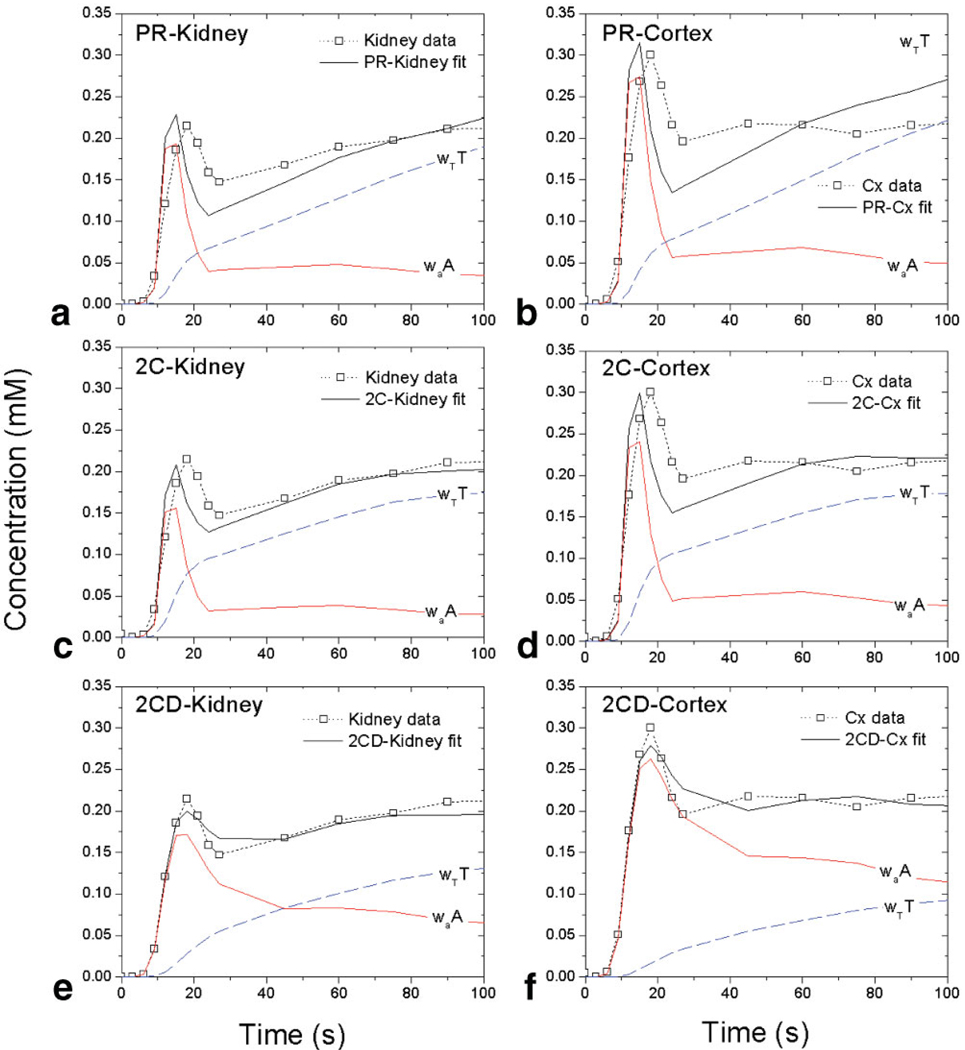
Figure 3.
Two-compartment model fits (solid black lines) and vascular (solid red lines) and tubular (dashed blue lines) compartmental contributions for MRR data (symbols and dotted lines) of a kidney with radionuclide GFR = 80.1 mL/min: (a) PR-Kidney, (b) PR-Cortex, (c) 2C-Kidney, (d) 2C-Cortex, (e) 2CD-Kidney, (f) 2CD-Cortex. The vascular and tubular contributions are labeled waA and wTT, respectively, where A and T are concentrations and wa and wT are volume fractions (see Appendix). In no-dispersion models (PR and 2C, top and middle row), waA is narrower and lower and wTT is higher than in 2CD (bottom row).

